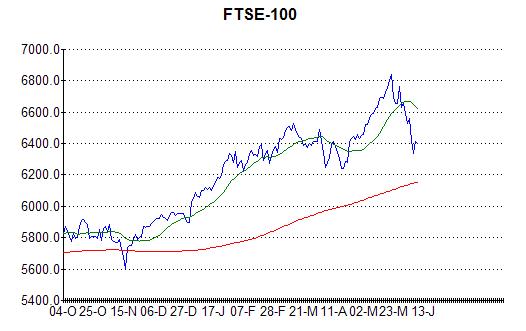
 And is it time to panic after all? The FTSE has fallen by about 7.5% and shows no signs of rebounding (it’s down another 100 points so far today), so it looks like it could fall significantly further. This decline has been brought about by talk of “tapering” QE in the US which just goes to show how dependent stock markets have become on the free money being pumped into them. To be honest, I’m not seeing any patterns in the chart at the moment, so I can’t really suggest what is likely to happen. The US authorities have suggested that it is time to wean the markets off QE so we could see a reluctance from them to act should the downturn continue.
The reason I had previously believed this decline would not be significant is that the Dow has not reacted anything like as strongly as the FTSE, having fallen only 3% so far. It still looks like it is consolidating above 15,000 like I suggested it might at the beginning of May. However sentiment seems to be turning negative with talk of a slowdown in Chinese growth coming into the picture. So the Dow could also fall further, but it is unusual for markets to turn so sharply after a strong run so I am still expecting it to bounce back. There is normally a sideways period before a fundamental turn in sentiment, so, once the market gets used to the idea of QE being reduced slightly, I suspect there could be quite a quick recovery. There is strong support just above 13,000 so I would be surprised if the Dow goes below that level and it may turn around way before then. It looks like I’ll have to play this one by ear!
 And is it time to panic after all? The FTSE has fallen by about 7.5% and shows no signs of rebounding (it’s down another 100 points so far today), so it looks like it could fall significantly further. This decline has been brought about by talk of “tapering” QE in the US which just goes to show how dependent stock markets have become on the free money being pumped into them. To be honest, I’m not seeing any patterns in the chart at the moment, so I can’t really suggest what is likely to happen. The US authorities have suggested that it is time to wean the markets off QE so we could see a reluctance from them to act should the downturn continue.
