 Research says yes, public health doesn't listen, and you suffer the consequences: too little benefits from generic interventions. And it could be so simple.
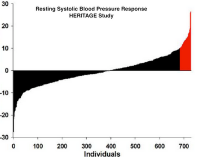
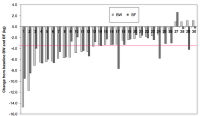
Different people always react differently to the same type of treatment. In my previous post I showed you the wide range of blood pressure changes in over 700 participants of the HERITAGE study's 20-weeks endurance exercise program (Figure 1). Unfortunately, most studies do not present their results in a way, which would allow us to construct such charts as in figure 1. But when they do, the charts look virtually the same. Figure 2 shows you how 30 obese men changed their bodyweight and fat weight as a consequence of a 12-weeks supervised exercise program [1]. As you can see, the mean change of 3.7 kg for both values (the horizontal red line) doesn't tell you anything about how these 30 men reacted INDIVIDUALLY to the program.

Figure 1
When your doctor tells you what exercise to do, what diet to follow or what drug to take, she refers to studies, which report their outcomes in terms of mean values for groups of participants. But as you know now, these values don't answer your question: What would my outcome have been, had I participated in this study? Which is the same as asking, what your results will be if you follow your doctor's advice.

Figure 2
The honest answer is: nobody knows. Augmented by: in all likelihood you will see some benefit; if you are very lucky you'll see an extremely large benefit. Or you might be unlucky and see no benefit at all. Call this the uncertainty principle of medicine.
You won't hear your doctor talking about it. Particularly not when he recommends lifestyle change as your first line of defense against heart attack, stroke or diabetes. For two reasons: First, public health is not concerned with your point of view. I'll get to this in a moment. Second, doctors know that lifestyle change is hard to sell as it is. So, why make it even harder by telling you the truth about the uncertainty of benefits. Think about it, we all like to enjoy now and pay later, if at all. That's certainly the case when it comes to cigarettes, salt, sugar and a sedentary lifestyle. To forgo these pleasures in favor of health benefits, which may or may not materialize decades from now, is simply not how we are wired.
But public health does not seem to get it. Even the American Heart Association's (AHA) latest invention, the seven health metrics, is nothing but the same song and dance, which has not had any impact on the health of the population. Let's look at it in a little more detail: the AHA has defined 7 metrics to help you navigate your way to chronic health. 4 of those metrics are behavioral - smoking, physical activity, BMI and diet. The remaining 3 are biomarkers: blood pressure, fasting glucose and total cholesterol.
Have all 7 in the green zone and you should do well with health. Exactly how well, that was the question Dr. Yang and colleagues had asked in a study which investigated (a) how many U.S. residents meet how many of those metrics and (b) how much of the U.S. population's death burden can be attributed to these risk factors [2]. Fast forward to the results. More than half of the population, 52.2%, meet only 3 or less of those 7 metrics. That's a 4 % increase compared to 20 years ago. Another 25% meet just 4 metrics. At the same time the percentage of people who meet at least 6 of the 7 metrics has gone down from 10.3% to 8.7%. The percentage of obese people has increased by 50%, and the rate of physical inactivity (that is, people who do not exercise at all!) has doubled from 15.6% to 31.9%. Compared with people who meet no more than 1 metric, those who meet at least 6 reduce their risk of dying by 50%.
When you look at these correlations, you'll certainly agree with the researchers' statement that "the presence of a greater number of cardiovascular health metrics was associated with a graded and significantly lower risk of total and CVD mortality". That's nice to know, but you are probably not so much interested in the number of deaths in the population, which are attributable to whatever health metric score is the flavor of the day. You are interested to know the answer to three questions: (a) what does it mean to you, if you don't meet those metrics, (b) how does your effort of getting these metrics into the green zone reduce your risk, and (c) which strategy should you use to lower your risk most effectively.
Fortunately, with a little bit of digging into published numbers, we can get fairly good answers to these questions. So, let's start with the first one: Dong and colleagues had done a fairly similar investigation asking how the number of AHA health metrics correlated with cardiovascular events (heart attack and stroke) in the Northern Manhattan Study Cohort [3]. The study's almost 3000 persons were on average 69 years old when they entered the study, and they were followed up for 11 years. Of those who had met at least 4 health metrics, 28% suffered a cardiovascular event during that time, vs. 32% of those who only met 3 or less metrics. That's a 4% improvement.
I don't know, how you feel about it, but my experience with our health lab's clients is that a 4% risk reduction doesn't make them go nuts about exercise and health food. I sympathize, because life is not all about self-flagellation with veggie burgers, tofu swill and weekly marathons. Which is why it is justified to go for the biggest possible health benefit that is achievable with the smallest possible effort. The answer hinges around the question of what is the most critical health metric. Back to Yang's investigation.
He had asked the question, which of the seven metrics, if met, would yield the largest reduction in deaths? If your bet was on smoking and obesity, you might be surprised to hear that blood pressure turned out to be a far more effective executioner, being responsible for 30% of the deaths in this cohort. With 24%, smoking took 2nd place, and obesity didn't show up as a killer at all. Which does not mean obesity doesn't cause death. You have to keep in mind that the average of the Yang study cohort was 45 years, and the median observation period was 14 years.
Again, what does all that mean for you? Principally you decide for yourself. I can only tell you what I practice with our clients in our health lab. For each case we define a benchmark biomarker depending on the individual's health profile. In many cases that's blood pressure or, better still, a biomarker of arterial function (I'll talk about the amazing role of arterial function in one of my next posts). We then agree on a certain exercise and dietary strategy, the effect of which we carefully measure in terms of change of the chosen biomarker. If that change does happen, and if it goes into the right direction, that's fine. If the client turns out to be one of the fringe cases, we need to adjust the strategy. We do that until we get it right. That's individualized prevention. While it does not eliminate the uncertainty principle of medicine, it makes prevention efforts far more effective and much more rewarding. It certainly beats following some generic advice drawn from studies, whose mean effect values conceal a wide range of possible effects.
Let's see when public health will finally see the light. Fortunately you don't need to wait for that to happen.
Arm yourself with one of those home measurement devices, and actively measure and chart your progress against your chosen lifestyle change strategy. You'll see very soon, how unique you are as a medical case.
1.King, N.A., et al., Individual variability following 12 weeks of supervised exercise: identification and characterization of compensation for exercise-induced weight loss. Int J Obes (Lond), 2007.
2.Yang, Q., et al., Trends in Cardiovascular Health Metrics and Associations With All-Cause and CVD Mortality Among US Adults. JAMA: The Journal of the American Medical Association, 2012.
3.Dong, C., et al., Ideal Cardiovascular Health Predicts Lower Risks of Myocardial Infarction, Stroke, and Vascular Death across Whites, Blacks and Hispanics: the Northern Manhattan Study. Circulation, 2012.
References
King NA, Hopkins M, Caudwell P, Stubbs RJ, & Blundell JE (2008). Individual variability following 12 weeks of supervised exercise: identification and characterization of compensation for exercise-induced weight loss. International journal of obesity (2005), 32 (1), 177-84 PMID: 17848941
Yang Q, Cogswell ME, Flanders WD, Hong Y, Zhang Z, Loustalot F, Gillespie C, Merritt R, & Hu FB (2012). Trends in cardiovascular health metrics and associations with all-cause and CVD mortality among US adults. JAMA : the journal of the American Medical Association, 307 (12), 1273-83 PMID: 22427615
Dong C, Rundek T, Wright CB, Anwar Z, Elkind MS, & Sacco RL (2012). Ideal cardiovascular health predicts lower risks of myocardial infarction, stroke, and vascular death across whites, blacks, and hispanics: the northern Manhattan study. Circulation, 125 (24), 2975-84 PMID: 22619283

