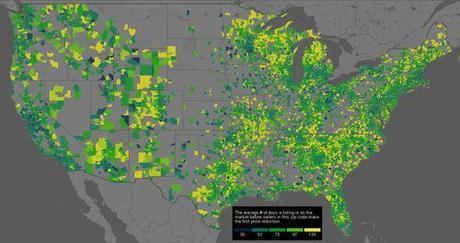
Price reductions seem to have become the name of the real estate game this past year, and Minneapolis continues to lead the nation in being the quickest to slash listing prices. In fact, the number of price reductions has been closely paralleling the number of new listings.

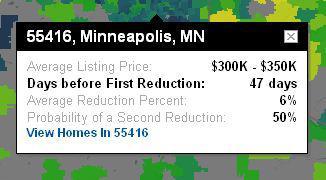
- Average listing price
- Days before first price reduction
- Average price reduction percent
- Probability of a second reduction
Whether you are a buyer or a seller, this is very useful information. The likelihood of a second price reduction can give you an idea of strong or weak the market is in your zip code... the more yellow it is, the slower the market.

Perhaps part of the reason we lead in our quick price reductions stems from area expectations. Our market has been historically strong. In fact, LendingTree recently reported that Minnesota has the second strongest housing market by state. We are accustomed to quicker market activity in the Twin Cities and sellers tend to react with price reductions if they aren't getting the response they expect. Buyers tend to wait for price reductions. Some of the first questions I hear from prospective buyers of a property are how many price reductions? when was the last one? how much was it? Buyers seem to be trained to expect price reductions before making an offer.
Looking at non-foreclosure listing data for one year at the end of the first quarter, Minneapolis averaged 45 days on the market before the first price reduction compared to a national average of 79 days on the market.
- Minneapolis, MN - 45 days
- Oakland, CA - 48 days
- Phoenix, AZ - 48 days
- Sacramento, CA - 49 days
- San Diego, CA 50 days
- Omaha, NE - 52 days
- San Jose, CA - 53 days
- Seattle, WA - 54 days
- Las Vegas, NV - 54 days
- Mesa, AZ - 55 days
Sharlene Hensrud, RE/MAX Results - Email - Minneapolis - St. Paul Real Estate Market Information
RELATED POSTS
- Minnesota has second healthiest housing market by state
- March Market Update... pending sales up
- Interactive Market Data... for condos, houses, townhomes, foreclosures, and more...
- National Map of 2011 Shadow Inventory

