One of the challenges that is ubiquitous for infectious disease epidemiology researchers is getting access to correct, up-to-date mapping data which can be reliably used. Often, the existing data is out of date, or plain wrong. Hence, each time we initiate a study in a new area, we undertake a rapid assessment of the study area to get a sense of the place and persons living there. One can imagine how important this exercise is, and understandably so. The fly in the ointment is that this is a process which is expensive, and time taking, and is often not considered to be a part of the main research agenda or research question, making it all that more difficult to allocate adequate resources to get it done. The problem gets even worse when, instead of a research activity, we are considering an outbreak or an emergency situation, where even time is not there!
This paper, published in PLOS ONE earlier this year, piqued my interest, and I have been meaning to write about it for a while now. This work was done in the course of the Ebola outbreak in West Africa, and reflects on the feasibility and cost of undertaking mapping the source villages of the Ebola Virus Disease (EVD) afflicted people, using open source tools, installed on self-owned smartphones, belonging to people living in and around the target communities.
The study itself was born in an environment which I can clearly see happening. In the African context, where this study was done, chiefdoms and other levels may not be analogous to the political stratification in India. However, tracing patients and their contacts is a challenging problem in either setting. Whoever has worked with infectious disease patients in low- and middle-income countries (LMICs) will thoroughly agree with the authors’ words:
Information regarding EVD positive cases was shared with the local Ministry of Health and Sanitation (MoHS) and Ebola response partners. However, MSF staff and partners were often confronted with challenges in obtaining reliable geographical information to enable the immediate tracing of EVD contacts and follow-up of discharged survivors. This was because the village of origin given by the patient could sometimes not be located on the available district maps, as some villages had similar names but were in different chiefdoms, or villages had both an official and an alternate village name. In addition, information about new villages, including satellite villages and up-to-date population numbers, were not available. This delayed the response, and MSF and MoHS staff often relied on knowledge of their local drivers, or had to stop and ask local residents for village locations.
Timely and effective containment of EVD relies on multiple interventions: isolation, surveillance, contact tracing, decontamination, health promotion, psychosocial support and community engagement [4]. These interventions cannot be implemented without accurately locating potentially affected areas. Therefore, accurate maps are an important tool for outbreak investigation and response, and facilitate visualising the extent of an outbreak [5].
Perhaps the strongest words in the entire paper are in the last sentence of the section I have quoted above.
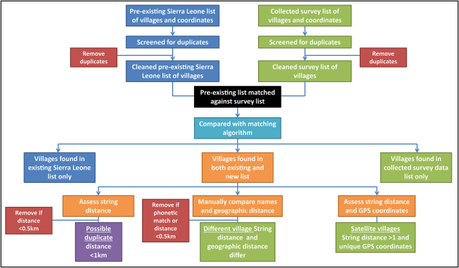
This study basically trained community-level volunteers, who owned their own Android Smartphones, and installed two open source software on it: survey software (OpenDataKit (ODK)) and navigation software (OpenStreetMap Automated Navigation Directions (OsmAnd)). These surveyors were trained in the use of the software, and trained to collect a simple set of data. They were then paired off with local motorbike riders to go to the target villages and collect the data. Validation was done by “comparing the village names against a pre-existing village name and location list using a geographic distance and text string-matching algorithm”.

Process of validation of mapping data.
The impact of this process was astounding:
Following de-duplication, the surveyors collected data from 891 villages with an estimated 127,021 households. The overall survey cost was €3,395; €3.80 per village surveyed.
The main expenses were related to HR and travel, as can be expected:
Costs were calculated considering the fixed daily cost of Okada drivers, which included fuel and vehicle maintenance costs. The daily cost for surveyors was calculated based on a fixed daily rate, which included costs for phone credit and recharging their smartphone battery. Both Okada riders and surveyors were reimbursed if they had overnight costs due to travel to distant chiefdoms.
‘Okada’ drivers refer to commercial local motorbike drivers, who are very conversant with the local terrain, and have the expertise to navigate the unpredictable and difficult roads of Sierra Leone. Their in-depth knowledge of the local language, affordability, and ability converse both in English as well as the local languages (Temne and Mende), made them an important part of the study.
The Okada drivers were paid €25 (SLL 120,000) daily to cover fuel, their daily worker rate and vehicle maintenance. The surveyors were paid €10 (SLL 50,000) daily to cover their daily worker rate, phone credit and smartphone battery recharging. The overall cost for collecting this survey data was €3,395; which equates to €3.80 per village surveyed.
In addition, the study built on the relatively high smartphone ownership in the region to minimize HR costs. Further equipment needed to maintain, transmit, store and manage the data also was not elaborate, and can easily be obtained even in several challenging situations.
The advantage of this survey was the minimal set of requirements necessary to securely collect data: one laptop; a server, such as a small mobile device which can operate via internet and range in cost from €10–25; a local web-based aggregation platform; ODK, OsmAnd and QGIS®open source software; Android smartphones and affordable local transport. The open-source software used in this survey is known to be virus-free, does not have any advertisement or need for payment, and the collected data belongs to MSF and is secured on an MSF password protected server.
Naturally, on reading this study, I started to consider if it would be possible to deploy a similar approach in the settings that I work in. It would probably not be out of question. And the only problem that I can foresee in the Indian setting is that a considerable number of slums have started to grow vertically in space-constrained Indian urban slums. Unless there is some sort of height data, it is likely to be problematic to de-duplicate families based on the two-dimensional locational coordinates. However, this is a very cost-effective, efficient, and community-oriented process that we could try out in some future study. Last year, I supported the Practicum Research work done by a Master’s Student from the Emory University, who worked on mapping of the local drainage systems. Whilst that is a more complex issue than mapping families of putting a locational dot where cases exist, in hindsight, we could have used some of these techniques!

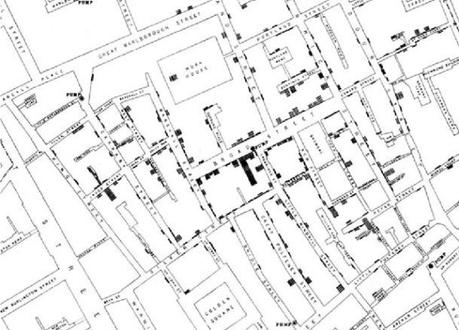
John Snow’s famous map of the 1854 Broad Street epidemic attempted to positively correlate disease intensity with proximity to a single water source, the Broad Street well and pump.
It has been over 150 years now since John Snow revolutionized the process of disease determinant detection simply by putting a dot on the map where there were cases of cholera. The entire field of epidemiology and spatial analysis perhaps owe their origin story to him! From cholera to ebola virus, the principles remain same, the challenges remain, although now we are much better at finding disruptive solutions for them!
Reference:
Nic Lochlainn LM, Gayton I, Theocharopoulos G, Edwards R, Danis K, Kremer R, Kleijer K, Tejan SM, Sankoh M, Jimissa A, Greig J, Caleo G. Improving mapping for Ebola response through mobilising a local community with self-owned smartphones: Tonkolili District, Sierra Leone, January 2015. PLoS One. 2018 Jan 3;13(1):e0189959. doi: 10.1371/journal.pone.0189959. eCollection 2018. PubMed PMID: 29298314; PubMed Central PMCID: PMC5752033.
