Disclaimer: This post reflects my personal opinion and does not represent any opinion or position of my employer (ICMR, GoI) or any agency I am affiliated with.
Yeah, forgive the bad pun in the title of the post... and another additional disclaimer: I am not a mathematical modeler. The discussions in this post are based on my work supporting the modeling team, and my epidemiological understanding of the COVID-19 epidemic.

There is a paper which is making the rounds on WhatsApp, titled "Age-structured impact of social distancing on the COVID-19 epidemic in India", which is a modeling paper written by Singh and Adhikari. If you have not read the paper, I am attaching it here for your perusal.
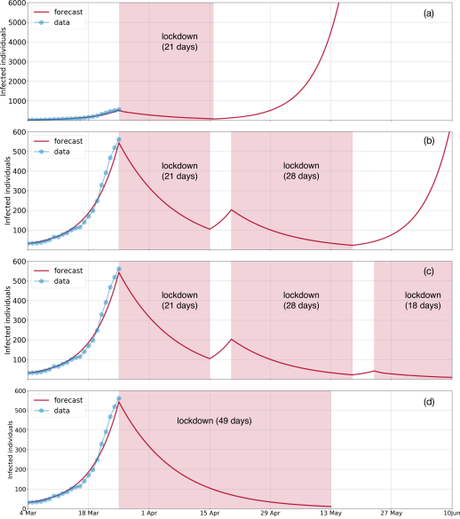
One of the images of this paper has been doing the rounds on WhatsApp. Figure 4 in this article forecasts the COVID-19 epidemic in India, with and without mitigatory social distancing in place. If you have not had a chance to see the graphs, here it is:
Before I come to this graph, and my thoughts on why it does not work, I want to talk about a couple of other aspects of the paper which attracted my attention. This paper was written specifically keeping in mind the 3-week lock down initiated in India. The model takes into consideration age and social contact, which is an essential driver of the COVID-19 epidemic. This becomes more important considering that although infections are commoner in 20 to 50-year-old persons, most deaths occur in those aged over 50 years. The China CDC Weekly analysis of 72,314 patient records (of which 44,672 were confirmed COVID-19 cases) identified this trend clearly:
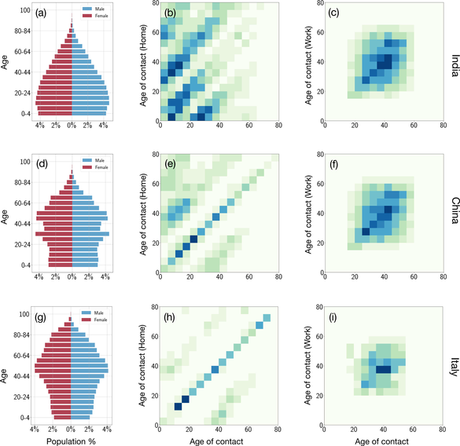
This age-structured model provides a good insight into the reality of interactions and social distancing. This is figure 1 in the paper, and is presented below:
 Age and contact structures of the populations of India, China and Italy. The first column shows population pyramids by age and gender. The second and third columns show the contact structures in households and workplaces with darker colours representing greater contacts. The diagonal dominance of these matrices shows strong assortative mixing in
all three countries. Significant differences appear in the off-diagonals. In India, the pentadiagonal character of the household contacts reflects the prevalance of three-generation households, which are smaller in China and negligible in Italy.
Just to make it clear, the darker squares indicate a greater extent of contact. The diagonal dominance of the contact is clear in all three countries. The immediate trend that comes to our notice is the multiple diagonals of interaction which occur in India, versus the predominantly unimodal intensity of interactions in the Chinese and Italian populations. What that suggests is that there are multiple loci of interaction between people of different age groups. There is a smaller patch of interactions between the groups aged 30-40 years and <20 years in China as well - representing the intrafamilial interactions. In case of India, where multigenerational families are not uncommon, there are multiple interaction points. I have highlighted this as the "box of risk" interactions in India, between people aged 20 to 40 years and those aged above 50 years of age.
What makes this area worth looking at is that it represents an especially high-risk zone, because out of all those who are infected, about half (44%) are in the 20-40 years age group, whereas over 90% of the deaths occur in persons older than 50 years. This box of risk underlines the need to have better protection measures for the elderly, and others with risk factors associated with either severe COVID-19 or death (such as type 2 diabetes, hypertension, kidney disease, TB or other lung diseases, cancers, other conditions causing immunosuppression, etc.).
This makes for an especially worrisome conclusion, which has not been highlighted in this paper: the case of intrafamilial transmission of COVID-19. According to the WHO-China Joint Report on COVID-19, human-to-human transmission largely occurred within families. The report explicitly mentions:
The Joint Mission received detailed information from the investigation of clusters and some household transmission studies, which are ongoing in a number of Provinces. Among 344 clusters involving 1308 cases (out of a total 1836 cases reported) in Guangdong Province and Sichuan Province, most clusters (78%-85%) have occurred in families. Household transmission studies are currently underway, but preliminary studies ongoing in Guangdong estimate the secondary attack rate in households ranges from 3-10%.
Report of the WHO-China Joint Mission on Coronavirus Disease 2019 (COVID-19)
Considering the fact that the family structures in India are similar to that in China, and as the contact matrix above suggests, there is significant interactions between family members in India. In fact, compared to China, the interactions between people aged over 50 years and those aged under 30 years is visibly more intense in India. Given this condition, and the likelihood of intrafamilial transmission of COVID-19, a lock down or general quarantine, is unlikely to stop the number of cases from accruing in the short term.
This brings me back to the much-discussed figure 4: and one major issue I have with this. The model assumes that the lag period between institution of lock down and a visible change in the epidemic curve occurs within a day - almost instantaneously. Have a look at the graphs:

However, as the transmission dynamics of COVID-19 indicates, this is unlikely to happen. There are two main reasons why this would actually not happen. Firstly, cases would continue to increase for a few days after the initiation of the lock down because the people who were infected prior to the initiation of the lock down would start manifesting symptoms in the first few days in the immediate aftermath of the lock down. Considering that 14 days is the outer margin of incubation period (time needed for infected people to become symptomatic), we could argue, for the first week at least, we would see an increasing trend of newer cases coming in. Secondly, given the lock down situation, the infected persons who are not quarantined in centralized facilities or do not maintain social distancing, would continue to transmit COVID-19 infections within their families, causing a slow but sure increase in the numbers. While we have not had enough time after the lock down in India to be able to calculate for the Indian setting, we can take a look at the numbers from some other countries to see how the epidemic evolved there after the lock down was imposed.
Lock down was initiated in Italy on March 9, 2020, and it is only in the last couple of days that new case detection has started to come down there.
Similarly, in China, lock down began with Wuhan city, on January 23, 2020, but the peak of new cases was reached on February 14, 2020. I am ignoring the mega peak on February 13, when over 13,800 presumptive cases were included in the reckoning as there was a change in the case definition.
A similar trend was seen for France, which went under a strict lock down for 15 days, starting March 17, 2020. The cases continued to rise thereafter, till the peak was reached on March 29, 2020, and only in the last two days have they seen fewer new cases coming in.
There are small dips in the immediate aftermath of the lock downs perhaps caused by difficulties in accessing testing in the setting of restricted mobility. This, however, soon gets corrected, and the cases start to spike. Given these experiences, it is likely that the model is too optimistic in expecting immediate reduction in the number of new cases seen after the lock down is placed.

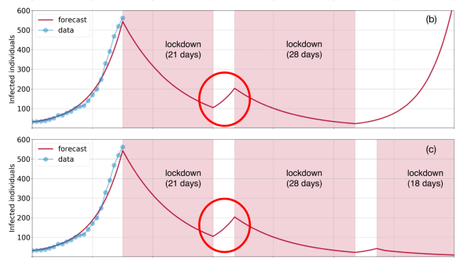
Further, in the (b) and (c) graphs above, where there are gaps in between two bouts of lock down, there is a small upward trending in the number of cases accrued. This is expected, but what is not clear to me is whether the same contact metrics were used to come to this gradient. If it is, then it is an unrealistic model, because there is going to be "compensatory hyperactivity" in people once the first lock down opens. Markets will be flooded with people, offices will be bustling with activity, public transport would be bursting to the seams, all Indians trapped abroad by the lock down will come thronging back in... and all of this is likely to accelerate the exposure of people, and increase the transmission of infections. To my mind, the inter-lock down period of opening up would actually see a larger spike in cases. By the way, talking about caseloads, this model suggests that in the absence of mitigatory efforts, the infection would affect 900 million Indians - several times larger than the scary projections of the CDDEP modeling.
Anyway, I am assuming that I have read the paper correctly, and understood what it means. When they say infected individuals in the graphs, I assume these are new cases reported every day. If I am wrong in any interpretations, please leave a comment below and suggest how I should alter my analysis. In any case, I agree with the authors that a 3-week lock down, in isolation, will not be an effective enough intervention to stop the deluge of COVID-19 cases. The lock down period is an important intervention, as it delays the peak of the epidemic, slows the growth of the epi curve, and provides the health and social systems the time to mount a response. But it will take an all of society intervention approach to actually put a dent in the numbers and reach meaningful reduction in the COVID-19 transmission.
