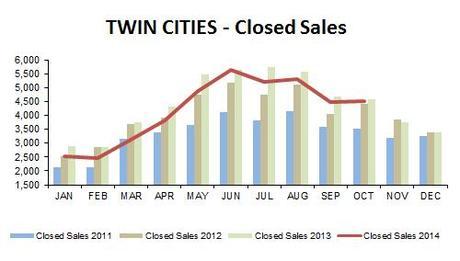
Twin Cities 2014 real estate sales have spent the year lagging behind the high levels of last year, but October 2014 sales were very close to 2013. It's easy to see the dramatic seasonal rise in sales peaking in June below... followed by a more gradual slowdown with October just a little ahead of last month and a little behind last year.
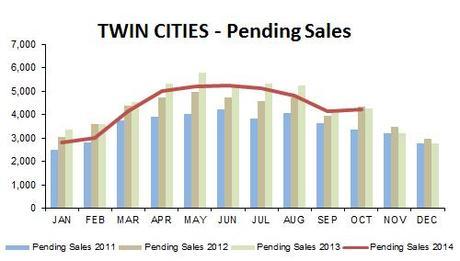
Pending sales showed a smooth arc for most of the year... good to see them rise a bit before heading south for the winter. Note that even though sales always drop over the holidays and in the coldest months, they don't stop... properties are bought and sold throughout the whole year.
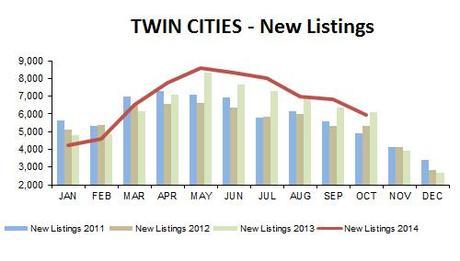
New listings continue their seasonal drop...
...as does the inventory of total homes available for sale.
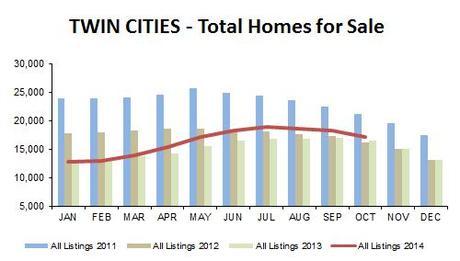
Although inventory levels are still historically low, it is good to see the supply of homes for sale finally above the last two years... a sign that the health of the real estate market is continuing to improve.
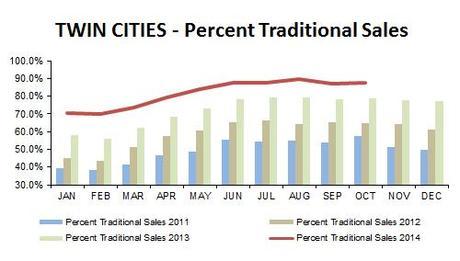
Perhaps the biggest impact on the market has been the decline in foreclosures, resulting in a growing percentage of traditional sales, dramatically illustrated in the chart below. Traditional dominated the market at 87.5% in October 2014.
The decline of low-priced foreclosures has also caused a continued rise in median price, dramatically floating above the previous 3 years in the chart below. This in turn inspires more traditional sellers to get back into the market... all signs of retunring good health for the Twin Cities real estate market. Median sale price for October 2014 was $209,000.
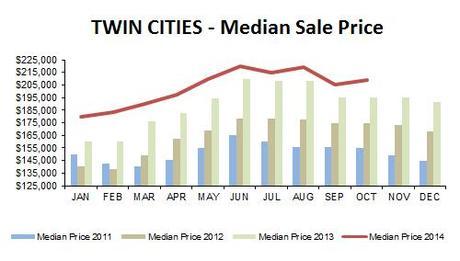
In spite of the dramatic improvement in median price, prices still aren't back to where they were in the bubble years... but we know from experience that those levels were not sustainable. It is encouraging, however, that prices are continuing on an upward trend flirting with levels in the bubble years.

The figures above are based on statistics for the combined 13-county Twin Cities metropolitan area released by the Minneapolis Area Association of Realtors.
Never forget that all real estate is local and what is happening in your neighborhood may be very different from the overall metro area.
Click below for more detailed information from the Minneapolis Area Association of Realtors.
- Local reports on 350+ metro area communities
- Overview of key trends for the region
Sharlene Hensrud, RE/MAX Results - Email - Minneapolis - St. Paul Real Estate Market
The team at HomesMSP.com -- Sharlene, John, Angela
RELATED POSTS
- Ready to Buy? Autumn is a Great Time!
- September Market Update... new listings and prices ahead of last year, sales lag behind

