Data Vizualization & Predication – Elephant Snack today 05-01-2020.
#My first Mode, I took the INRvsUSD values from the website as CSV
#and cleaned the data and tested the predictor values against the response variable
#tested the mode using below techniques
# R2(square) of the model
# Cooks distance of the model
# Confidence using Confint
# AVPlots
# Adjusted R2 value
# AIC Value – Akaikie Information Criterion
# Stepwise Analysis
# Null hypothesis test method = Chi
# Finally Chose the the best fit model as Price (response) vs (High & Open) (predictor)

#Set up WOrking Directory
setwd(“C:/Users/asket/Documents/Exploratory Data Analysis/DataSet/INRvsUSD”)
#install library
library(MASS)
library(Hmisc)
library(car)
#upload the file
inrvsusdprediction<-read.csv(“USD_INR_Historical_Data.csv”)
#Data Cleaning
names(inrvsusdprediction) <- gsub(“..”, “”, names(inrvsusdprediction),fixed = TRUE)
names(inrvsusdprediction) <- gsub(“ï”, “”, names(inrvsusdprediction),fixed = TRUE)
as.character(inrvsusdprediction$Change)
inrvsusdprediction$Change<-sub(“%”,””,inrvsusdprediction$Change)
inrvsusdprediction$Change<-sub(“-“,””,inrvsusdprediction$Change)
as.numeric(inrvsusdprediction$Change)*10
as.numeric(inrvsusdprediction$Change)
class(inrvsusdprediction$Change)
inrvsusdprediction<-inrvsusdprediction[c(-1)]
#summary of the data
summary(inrvsusdprediction)
#response variable is INR PRICE
#learn about variables
#to subplot
par(mfrow=c(1,2))
#INR Price
boxplot(inrvsusdprediction$Price,main = ‘INR-Price’)
hist(inrvsusdprediction$Price,main = ‘Hist-INR-Price’)
#Open Price
boxplot(inrvsusdprediction$Open,main = ‘Open-Price’)
hist(inrvsusdprediction$Open,main = ‘Open-Price’)
#High Price
boxplot(inrvsusdprediction$High,main = ‘High-Price’)
hist(inrvsusdprediction$High,main = ‘High-Price’)
#Low Price
boxplot(inrvsusdprediction$Low,main = ‘Low-Price’)
hist(inrvsusdprediction$Low,main = ‘Low-Price’)
#%change in Price
boxplot(inrvsusdprediction$Change,main = ‘Change-in-Price’)
hist(inrvsusdprediction$Change,main = ‘Change-in-Price’)
#to check the response variable noramlity, if the p value is > 0.05 then okay else take sqr
#root of the reponse variable and bind them in the data frame
#and check the box plot for normality
#then run the shaprio test
shapiro.test(inrvsusdprediction$Price)
#check multi collienarity
pairs(inrvsusdprediction,gap = 0.5)
attach(inrvsusdprediction)
#linear relationship between the predictors
#VIF – Variance Inflation factor
inrvsus.lm<-lm(Price~Open+High+Low,data = inrvsusdprediction)
summary(inrvsus.lm)
vif(inrvsus.lm)
#if any values are > 10 then there is collienarity between variables
#we do not have any so we can move ahead
par(mfrow=c(1,2))
plot(Price~Open)
smooth.line = smooth.spline(Price~Open,spar = 0.99)
lines(smooth.line,col= ‘red’)
plot(Price~High)
smooth.line = smooth.spline(Price~Open,spar = 0.99)
lines(smooth.line,col= ‘red’)
#check the linear model summary for the relationship between the variables.
inrvsusd.model <- lm(Price~Open+High, data = inrvsusdprediction)
summary(inrvsusd.model)
#residual model
ResidualsInrUSD<-resid(inrvsusd.model)
print(ResidualsInrUSD)
#fitted model
PredictedINRUSD <-predict(inrvsusd.model)
print(PredictedINRUSD)
par(mfrow=c(1,1))
plot (ResidualsInrUSD~PredictedINRUSD)
#Cooks distance
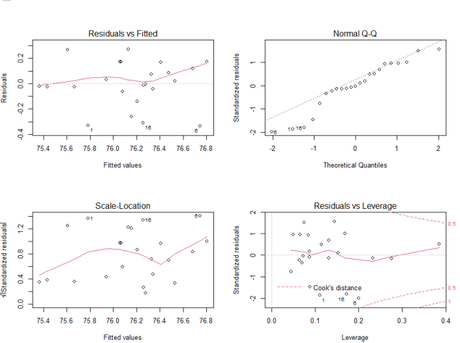
par(mfrow=c(2,2))
plot(inrvsusd.model)
#Confidence interval 2.5% & 97.5% should not be 0, if 0 then its
#less influential
confint(inrvsusd.model)
#Partial Regression Plots
avPlots(inrvsusd.model)
#hypotheis test of each model
OpenvsHigh.model <- lm(Price~Open+High, data = inrvsusdprediction)
inrvsusdHigh.model <- lm(Price~High, data = inrvsusdprediction)
inrvsusdOpen.model <- lm(Price~Open, data = inrvsusdprediction)
inrvsusdLow.model <- lm(Price~Low, data = inrvsusdprediction)
#Null Hypothesis Test
anova(inrvsusdHigh.model,inrvsusdOpen.model,test =’Chi’)
#summary of each model the highest r2 value model is a good mo
summary(OpenvsHigh.model)
summary(inrvsusdHigh.model)
summary(inrvsusdLow.model)
#Akaike Information Criterion – Lowest AIC value for the best model
AIC(OpenvsHigh.model)
AIC(inrvsusdHigh.model)
AIC(inrvsusdLow.model)
#Best model after all testing
summary(OpenvsHigh.model)
#model final testing
par(mfrow=c(2,2))
plot(OpenvsHigh.model)
#tested the price of the INR is highly depended on the Open & the high value against USD
ResidualsInrUSD<-resid(OpenvsHigh.model)
shapiro.test(OpenvsHigh.model$residuals)
avPlot(OpenvsHigh.model)
vif(OpenvsHigh.model)
To be Continued….!!
