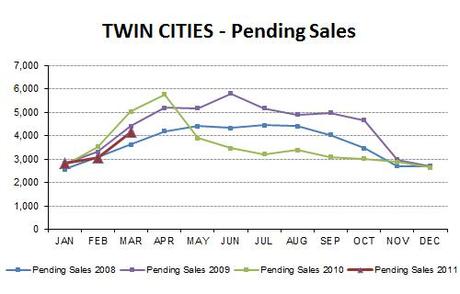
March pending sales jumped as it usually does at this time of year. Not as high as the last two years during the tax credit, but a healthy jump nevertheless. The weekly report that came out April 11 showed the highest pending sales totals so far this year... hopefully a good sign.
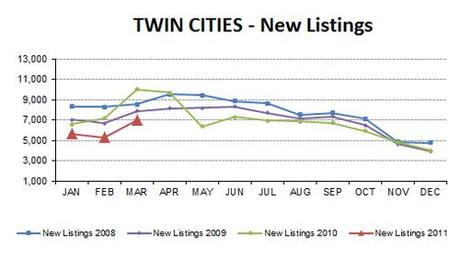
New listings also jumped up, still significantly below last year as expected but also below 2007-2009. It will be interesting to see how the rest of the years compares.
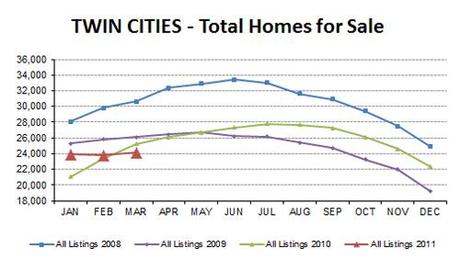
The total number of homes available for sale has stayed so steady so far this year it is almost surreal... a similar non-curve to 2009 and the smallest selection of homes for sale at this time in the last 4 years and maybe longer. This is one of those good news - bad news stories... good news for sellers because they have less competition and bad news for buyers because they have fewer choices.
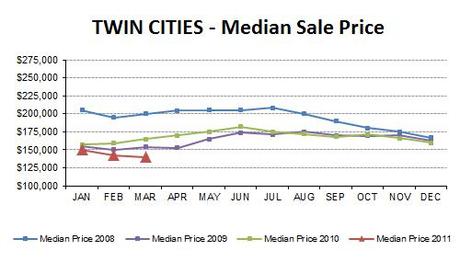
Median price dropped yet again... this month's chart showing year-over-year to better see that comparison. Foreclosures made up 55% of last month's sales which put downward pressure on prices. Price reductions have been neck-in-neck with new listings lately. It will be interesting to see if median price rises again because of the lower supply of homes available for sale.
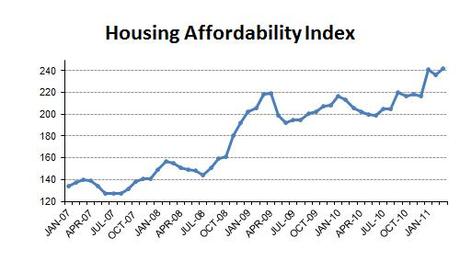
Last month housing affordability dropped a bit and I thought maybe it had peaked... but lower prices this month combined with continued low interest rates and an unemployment rate 2 points below the national average of 8.8 helped it hit yet another peak. The mantra that this is a great time for buyers still holds true.
The figures above are based on statistics for the combined 13-county Twin Cities metropolitan area released by the Minneapolis Area Association of Realtors. Click here for local reports on 200+ metro area communities. Click here for current interactive market analytics by MLS area, city or zip code.

