Hi Everyone, Welcome to this learning blog. Here we will try to understand basics of statistics and modelling of data sets using simple regression analysis. Learning Data modelling is one of the important task in problem solving involving huge data sets. So, that it can design suitable model for the problem in hand is is solving.
Before going forward. Lets understand one important tool of statistics. Regression.
What is regression? Why we use it? Where we can use it? What is its role in data modelling?
As per wikipedia definition
In statistical modeling, regression analysis is a set of statistical processes for estimating the relationships between a dependent variable (often called the ‘outcome’ or ‘response’ variable) and one or more independent variables (often called ‘predictors’, ‘covariates’, ‘explanatory variables’ or ‘features’).
Wikipedia
Types of Regressions possible/ we generally deal with:-
- Linear regression
- Logistic regression
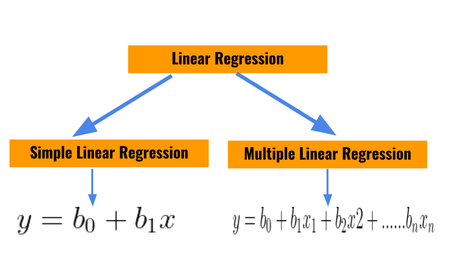
Further, Linear Regression is of two types.
 Types of linear regression
We will learn about logistics regression regression in next lectures. For now we will focus on simple linear regression analysis and its basics, so that later we can use this in data modelling.
Simple linear Regression & its use in data modelling
Lets understand use of simple regression analysis with one example:-
Say you are in college with total 1000 students. You want to know that after one year how much marks in terms of percentage in increased after one year of stay in your college. Why this problem statement. As this can tell, if students marks can increase in future or not, if it is is not increasing as peer/competitor college than there is underlying problem in college system which needs to be addressed. Although this is another problem. But this simple question can help us compare different college and on the basis of there marking system. And this is done by simple mathematical analysis. Which can forecast possible increment of marks in one year based on previous year marks data using simple regression analysis.
To simple here the output/ dependent variable (y) as increase in GPA/percentage marks of student i.e. (Y).

Can you tell me what could be x (independent variable) in this situation according to you.
If you are thinking duration i.e. 1 year growth etc. then you are right !!!
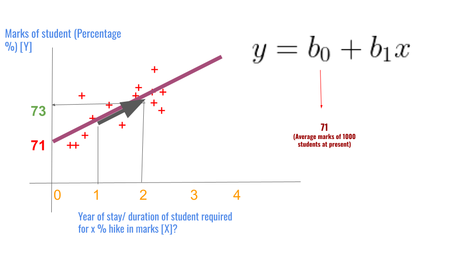
What data set we have? Current or previous years marks history of student. Now we can populate the marks of student from previous years. To understand the situation see below figure.
 Understanding Simple linear Regression via example
Now if you see system/ any software we use will return two constant base on enter teed data of students marks are b0, b1. As written above b0 is could be avg marks of all students of students during first year of stay. Those + signs are data point of marks of students in previous years. Say we want to know how much marks after studnets who are in first year will increase when they will go in 2nd year. So simple we know b0, b1 we need to enter x=2 for the forcast, we can get y as 73 percent. which we can see in above plot.
What insights we can drive??? What more we can do???
This Shows in second year there is high possibility of 2 percent increment in marks of students overall in your college. Similarly we can do this for n number of year of stay. But one this to note/ ask ourselves. What is accuracy of this forecast???? As you can see line over all datasets shows good overlap on datasets. Hence, we can say it has produced better fitting model (i.e. values of constants b0, b1). Now how to check this accuracy we can learn in next blogs. For now, Just remember for simple one variable problem statement we can forecast better insights using simple regression. But if there are other things you need to address i.e. what to do to increase students marks by 5 percent than we might need to incorporate more variables say which subject is lacking , which is doing good etc… hence this type of problem statement can be addressed using higher two or multiple variable models. we will learn them in subsequent blogs.
Conclusion
In this blog we understood basics of linear regression more importantly simple linear regression, where it can be used with one example. In next blog of this series we will discuss about how to find best fit model using simple regression using live data sets. How to know multiple regression equation to be used, how to implement this in R software and much more etc. For now, happy learning>>>…

To Get Latest updates in your inbox!
Join today our exclusive subscribe option to get monthly updates, tips and one to one expert discussion on topics!
SUBSCRIBE NOW
