

What's new in LandViewer
# 1 Time lapse animation
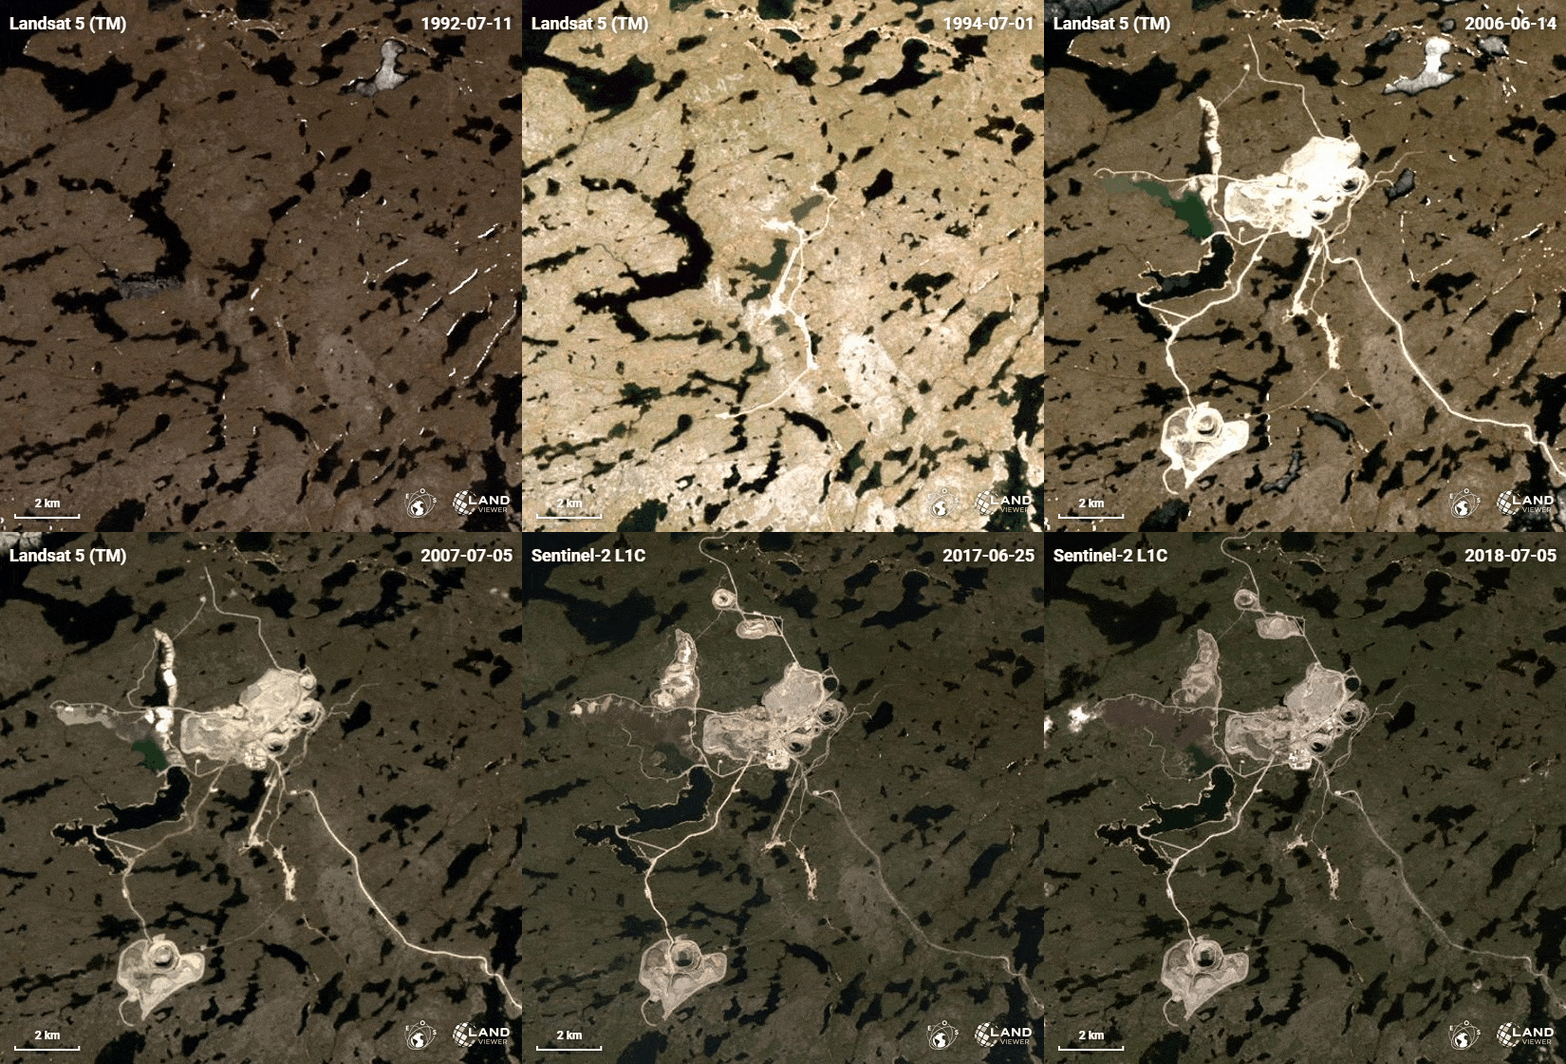
One of the most engaging features in the scope of recent LandViewer updates is Time-lapse animation. With this function, it's easy-breezy to create a video in order to visualize whatever changes occur over time. Additionally, you can apply band combinations and use the custom settings: change quantity of frames per second, resize the video, create a GIF, show dates and download the result. On top of that, it's proven to be the perfect way to share the data in form of the captivating animated stories with the internet users across the globe.
# 2 High-resolution satellite data
Based on the particular use case, LandViewer is able to provide you with the imagery in form of a bundle (PAN+MS), pansharpened, georeferenced or orthorectified product. Lately, we've restocked the traditional list of sensors ‒ Sentinel-2 and Sentinel-1, Landsat 7, 8 missions, MODIS, CBERS-4, NAIP ‒ with the newly-evolved high resolution datasets.

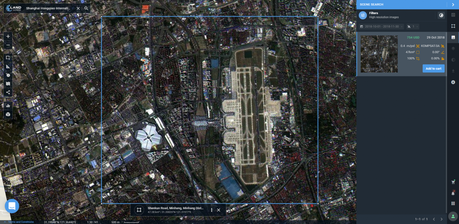
LandViewer has pitched the deal with the world's three top providers of high-resolution imagery, Airbus Defense and Space, SI Imaging Services, SpaceWill, for most accurate, reliable and timely data, which is essential in incredibly diverse applied fields. As a result, from now on you can browse, preview, purchase on the spot and store the image products from Pléiades 1a/1b, SPOT 5, SPOT 6 and SPOT 7, as well as KOMPSAT-2, 3, 3A and SuperView, Gaofen 1, 2, and Ziyuan-3. In LandViewer the procedure is easy, fast and is supported by our technical team from the beginning to the end.
# 3 Dynamics from Time Series Analysis
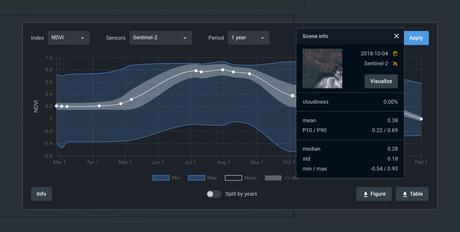
When it comes to observing the dynamics over a long period of time, it's always about dealing with tons of historical data yet together with the newest imagery from the selected sensor. With time series approach, which is widely used in vegetation growth dynamics observations, phenological crop identification, and land use change detection among other applied fields, you can save both your time and efforts, constructing a spatiotemporal vegetation indices (VI) graph.
# 4 New spectral indices for vegetation cover analysis
To evaluate vegetative cover, the specific set of vegetation indices (VIs) can be calculated from the spectral measurements. The spectral response of vegetated areas comprises a complex mixture of vegetation reflectance, environmental effects, soil brightness, moisture, etc. Besides, the VI is affected by spatial‐temporal atmospheric variations. With all that said, in order to enhance vegetation response and minimize the above-mentioned impact, LandViewer has added ARVI, SAVI, EVI, GCI, SIPI and NBR indices on the list. The enhanced analysis deals with classifications, ordination, and a correlation between the vegetation and its environment, and is designed to facilitate a more accurate ecological interpretation of data.

