Welcome to the 12th entry in our monthly income and traffic report!
In this series we share our traffic, earning, and spending figures each month so you can get a glimpse inside the business of travel blogging. In addition to sharing these for your use, by publishing our information we are also able to stay on track with our own goals for our business.
Last month we shared our results from November, and now that December has ended, it is time to share those figures too! So how'd we do? Read on to find out!
Living the Dream's December 2015 Traffic
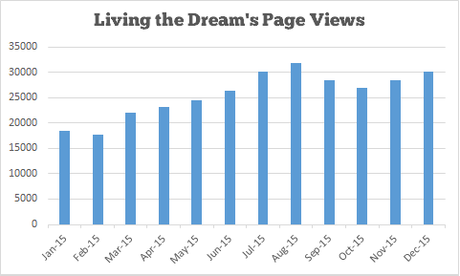
Our traffic for December 2015 was approximately 30,200 page views.
When compared to our traffic in November, our December traffic was up by 3% on a per day basis and when comparing December 2015 to December 2014 our traffic was up by 107%.
As this is the end of year report, I am pretty excited to say that we increased our traffic over 100% since migrating from WordPress in December of 2014. I was hoping for significantly higher traffic, but I will be more than okay with hitting this milestone- let's hope for another 100% in 2016!
On the Discover the Burgh front, the newest site in our brand, we had another huge leap from 12,500 monthly page views in November to over 19,800 page views in December- a gain of 55%. This was another huge month for us, and for the first seven months of operating the site this was our slowest growth so far (which really says something). We'll see how January goes from there as another 50% would put us on par with Living the Dream in 1/10th the time!
Living the Dream's December 2015 Income
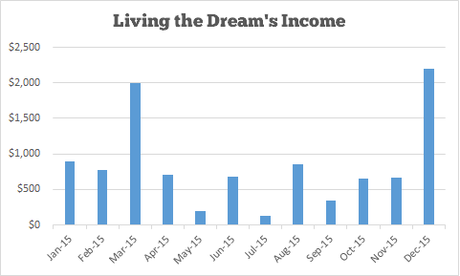
Our booked income for December 2015 was approximately $2,200.
Just when I go ahead and complain about our income being flat for many months, we have an incredible end to the year (amounting to about $10,000 in committed earnings). This was primarily thanks to a huge freelancing contract coming our way which really helped the month turn around quite nicely. Although we're not foreseeing this one continuing into January, we're happy with how it worked out as it came at a time when it was sorely needed.
Our earning dollar amount includes the following breakdown:
Direct Advertising: $850
Amazon Affiliates: $90
Adsense: $4
Freelancing: $1,200
Hotel Affiliates: $80
Other Affiliates: $0
Want to support our site in your travels? Our Book Your Trip page has affiliate links to all of the services we personally use and recommend when traveling and blogging. By making a purchase through our links we'll receive a small commission and the price you pay will not change.
Living the Dream's December 2015 Expenses
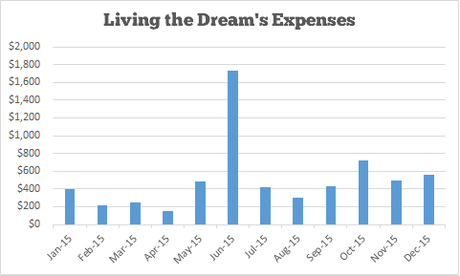
Our spending for the month of December included the following:
Social Media Advertising: $315
Staff Payments: $50
Equipment Purchases: $190
Total: $550
I kept our spending low for December as I did not expect our income to be high; however, since our freelancing contract came through we had a bit of free income that we reinvested into the site. We ended up purchasing a digital Nest Cam for our city blog to stream the view from our house and create time-lapse videos.
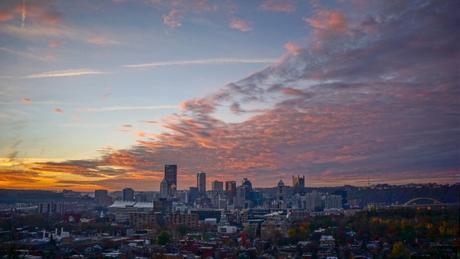
Considering our house has one of the best views of the city, and a recent video on our Facebook page went viral with over 1,000,000 views (generating over 5,000 new fans), pursuing more video on our site just makes sense.
We're looking forward to getting it up and running in January!
Goals for 2016
Our goals for 2016 are simple, and are the same for both of our sites.
The first is to increase our traffic. On Living the Dream we are targeting 100% growth in 2016 to 60,000 page views (6% month over month average). On Discover the Burgh we are targeting 500% growth in 2016 to 100,000 page views (15% month over month average).
I could target higher traffic here on Living the Dream, but our business plan right now is to stay the course until our local blog takes off- then our new plan for this site will come into effect.
A sub-goal of this one is to continue our growth on Discover the Burgh's Facebook page, with a target of 70,000 fans by the end of the year. This number was determined at our current growth rate (800-1,200 per week) and would also get us to our traffic target if our page view conversion remained the same (2-5% per article per day).
The second is to increase our earnings. We pulled in about $10,000 in 2015, which was lower than in previous years. We're hoping to increase this to at least $20,000 in 2016 through monetizing our local blog. I suspect we'll still reinvest everything like we did in 2015, but if we exceed that figure we may start taking the profit.
Our monetization plan includes three separate tasks. The first is through increasing our direct advertising on Discover the Burgh, something we have not done yet as we've been focusing on increasing our page views. The second is through affiliate sales on both of our sites- primarily through hotel bookings and Amazon orders. The final task is through offering our services to local businesses for photography, business assistance, and more.
The first step is getting our name out there, which is our big plan for the first quarter of the year.
Check back in January and the rest of 2016 and we'll let you know how we did!