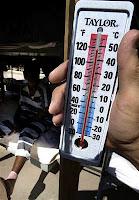
 Two of the most viewed posts on this blog are the “Perfect Climate” posts from last January (Part 1 here and Part 2 here). The whole point of those posts was to identify the “perfect” climate by reviewing the average – the normal – temperatures (daily mean, diurnal variation, seasonal differences, etc.) for hundreds of locations around the United States. During the extensive research for those writings, as I spent many many hours poring over temperature data, I became curious in the opposite, not the normal, but extreme temperatures.
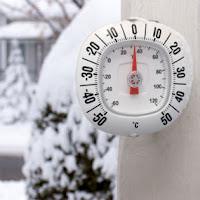 In particular, I wondered what the high and low temperatures were across the entire country on any given day. How hot does the hottest place get in summer or the coldest in winter (and vice versa)? Surely it would be interesting to know this bit of trivia. It took a little searching, but fortunately, I found this exact information published by the National Weather Service (for populated places). Unfortunately, it’s published one day at a time with only the previous couple of days of national highs and lows listed. Also, for whatever reason, the NWS only publishes this information for the continental U.S., no Alaska or Hawaii (or for that matter, no Puerto Rico, Guam, American Samoa, etc.). Based on the lower 48’s extreme temperatures, Hawaii may occasionally have the nation’s warmest weather, but Alaska would almost certainly claim the coldest temperatures on most days (October to April anyway).
I patiently compiled the daily U.S. high and low temperatures (and the corresponding location) over the last year (January 22, 2011 to January 21, 2012). Some would call this obsessive or silly or strange, to which I can offer no really good rejoinder. But I did it, and crunching the numbers I found some interesting things to note (all temperature values in degrees Fahrenheit):
Extreme Temperature Facts
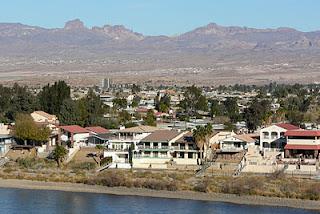
Bullhead City - likely on a hot day
Highest high. On back-to-back summer afternoons, August 24 and 25, in Bullhead City, Arizona, the thermometer hit a suffocating 119 degrees. Bullhead City is located in the heart of the Mohave Desert along the Colorado River about 90 miles south of Las Vegas. The 119 degree temperature is actually seven degrees below Bullhead City’s record high of 126 degrees (126!). There were fourteen other days when the national high was at least 115 degrees, and all but one of those recordings was unsurprisingly taken in the desert southwest (Arizona and California).
Let me digress to discuss record high temperatures. The highest recorded temperature in North America, and the second highest ever recorded on Earth, is 134 degrees at Furnace Creek in Death Valley, California on July 10, 1913. That was nearly a century ago, and I have no idea who was reading that temperature, how the thermometer was calibrated, or whether it was even set-up right. Call me a skeptic, but 134 degrees in the shade seems rather high even for a record high temperature. Similarly, the highest ever recorded temperature on Earth – 136 degrees – was recorded in the Sahara at Aziziya, Libya on September 13, 1922. This 90-year-old recording is in dispute. If it is indeed inaccurate, what is the real highest temperature recorded in modern times?
Lowest low. Later January and early February are the coldest time of the year (in the northern hemisphere), so it’s not surprising that the year’s lowest temperature, -43 degrees, was recorded at Chinook, Montana on February 1. There were nine other days when the national low was -35 or lower (spread across the northern tier of the country). I can’t imagine cold like that; I suspect it would kill you fast. (I count myself lucky that I’ve never felt subzero temperatures.) Chinook is located in far north Montana, and in this case it’s ironically named. A Chinook wind is the famous warm wind that flows down the eastern sides of the western U.S. and Canadian mountain ranges (these are more generally known a foehn winds). Chinook could have used a Chinook on February 1.
Highest low. The highest low was also recorded in Montana. On July 31 in Wisdom the national low was just 39 degrees. Wisdom is located at high elevation near the Bitterroot Mountains in the southwest of the state. All told, there were just 28 days – less than a month – when the national low was above freezing.
Lowest high. The lowest high on the other hand was recorded just a couple of weeks ago (January 14) in Torrance, California (Los Angeles) where the national high was a very temperate 73 degrees. There were only five days when the national high failed to reach 80 degrees.
Largest daily difference. On February 25 the high temperature in Edinburg, just a few miles north of the Rio Grande in far south Texas was 96 degrees. On the same date 1,700 miles to the northwest in Cut Bank, Montana, just miles from the Canadian border, the low temperature was -35 degrees. That’s a difference of 131 degrees, the largest difference between high and low recorded all year.
Smallest daily difference. Conversely, on October 5 the national low was in Grand Canyon, Arizona at 31 degrees. The national high was again in Edinburg at 95 degrees. A difference of just 64 degrees, the smallest daily difference between national low and high.
High and low in the same state. Interestingly, there were five days in the year when the national high and low were recorded in the same state: May 5 in Arizona (high: Bullhead City; low: Grand Canyon), June 20 in Arizona (high: Goodyear; low: Grand Canyon), July 25 in California (high: Death Valley; low: Truckee), August 8 in California (high: Needles; low: Truckee), and October 11 in Arizona (high: Yuma; low: Grand Canyon). In each of these cases the dates were during the “warm” part of the year with very high temperatures in the Mojave Desert contrasted with low temperatures at high elevations. The highly varying topographies of Arizona and California allow for this anomaly. Bullhead City and Grand Canyon are just 150 miles apart, meaning on May 15 you could have woken up to subfreezing temperatures in Grand Canyon and driven to Bullhead City for lunch as temperatures approached 100 degrees. (For comparison, I recently traveled from winter Baltimore to tropical St. Lucia, 2,000 miles to the south, and the temperature difference was less, “only” about 60 degrees.)
Days above 100 degrees. On February 27 the national high was 103 degrees in Laredo, Texas. It was the earliest date with a high in triple figures. The latest date was October 23 in Gila Bend, Arizona (101 degrees). In between there were 174 other days with a high above 100 degrees, including 129 consecutive days between May 17 and October 3.
Where it’s (Really) Hot – States, Regions, and Cities
Here’s a list, by number of days, of the states, regions, and cities that experienced the hottest of hot weather:
Rk State Days1 Region Days1 City Days1
1. Texas 147 South Texas (TX) 146 Laredo, TX 67
2. Arizona 77 Southwest (AZ/CA/NV) 112 Bullhead City, AZ 34
3. California 73 Florida (FL) 45 Pecos, TX 25
4. Florida 45 Tornado Alley (AR/KS/OK/TX) 34 Gila Bend, AZ 17
5. Oklahoma 14 Coastal California (CA) 25 Harlingen, TX 17
6. Arkansas 4 Northern California (CA) 1 McAllen, TX 17
7.
Kansas
4
Edinburg, TX
15
8.
Nevada
4
Fort Myers, FL
14
9.
Needles, CA
14
10.
Thermal, CA
12
1 includes ties.
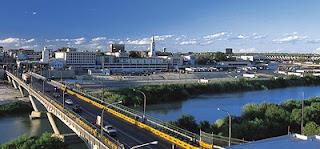
Laredo - the most common location for the national high
Perhaps it’s not too big of a surprise that sun drenched southern Texas experiences the hottest temperatures on so many days. Warm air blows up from Mexico and temperatures soar in placesremoved from the coast. The number of days the national high was in South Texas is about the same as the region most people associate with scorching sun, the Mohave and Sonora deserts of Arizona, California, and Nevada. The crucial difference is that South Texas is home to the nation’s high in spring and fall while the southwest is hottest in deep summer (though it’s still meltingly hot in summer Texas). 2011 was an especially hot year in the plains of northern Texas, Oklahoma, Kansas, and Arkansas. Dallas nearly set a record for the number of consecutive days with a high over 100 degrees. I wonder if 2012 will follow the same pattern or if this area will be spared 110+ degrees days this July and August?
By contrast, coastal California, and in this case this pertains to southern coastal California (Los Angeles, Orange County, San Diego), and Florida frequently boast the nation’s high temperature in winter, and those highs are usually in the pleasant 70s and 80s. This emphasizes a point I made in my original climate posts, the places to go to escape the winter cold are Florida (especially South and Central Florida) and southern California – Miami, Tampa, Los Angeles, San Diego, etc. The places to go to hide indoors during summer are in the southwest and interior Texas – Phoenix, Las Vegas, Laredo, etc.
An important point to note, the nation’s high temperature over the last year was recorded in Riverside (11 days), Ft. Lauderdale (8), Phoenix (6), Anaheim (4), Miami (3), Tampa (3), San Antonio (1), and Tucson (1) – major cities. The high frequently occurred in other big cities (or at least places you’ve heard of), like Laredo, Fort Myers, and Palm Springs. This just shows that people like to live in warm places, even if that means they have to deal with unbearable summer heat (Phoenix, Bullhead City) or clinging humidity (Gainesville, FL, Corpus Christi, TX).
Where it’s (Really) Cold – States, Regions, and Cities
Here’s a list of the states, regions, and cities that experienced the coldest of cold weather:
Rk State Days1 Region Days1 City Days1
1. Montana 69 Mountain West 203 Stanley, ID 43
2. Wyoming 68 Midwest / Great Lakes 46 West Yellowstone, MT 37
3. Idaho 44 Northern Plains 30 Truckee, CA 14
4. Colorado 35 Northeast 27 Embarrass, MN 13
5. Minnesota 28 Northern California 25 Saranac Lake, NY 13
6. California 26 Southwest 17 Bryce Canyon, UT 12
7. Arizona 14 Northwest 14 Lake Yellowstone, WY 12
8.
New York
14
Alamosa, CO
10
9.
Oregon
12
Gunnison, CO
10
10.
Utah
12
1 includes ties.
It freezes every month of the year in Stanley
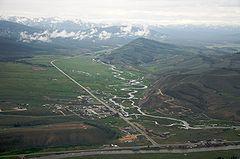
Cold can confidently be found in two places: high latitudes and high elevation. Hence the nation’s coldest temperatures are often found in the north – Montana, Minnesota, northern New York, and interior New England, or at high elevations, which includes much of the western United States (including large parts of sunny California and Arizona). By and large, the north dominates the list of coldest temperatures in winter and high elevations dominate the list in summer. Some places, are both northern and high (hello Stanley, Idaho), a recipe for the nation’s coldest temperature. Take a look at the list of the ten cities with the most days with the coldest temperature. Ever heard of them? Maybe one or two, but these are very small, often remote locations. In fact, and notably dissimilar to the hottest temperature locations, the coldest daily temperature was not once recorded in even a medium size city. More proof that Americans choose to live where winter isn’t scary cold.
An Oddity
On July 9 the nation’s high was 109 degrees in Medicine Lodge, Kansas, which is southwest of Wichita a bit north of the Oklahoma border. On September 23 the nation’s low was 22 degrees in Medicine Bow, Wyoming, which is about equidistant from Cheyenne and Caspar in the southeast of the state. I don’t know how many U.S. place names start with “Medicine”, but it can’t be many. It’s quite a coincidence that two such places show up (on opposite sides) of this rather specialized list.
---
Examples of All Time Heat and Cold of Selected Major Cities
For comparison to this one year of extreme temperatures, here are the all-time record highs and lows for a group of (geographically dispersed) major U.S. cities:
City Record High Record Low Difference
Atlanta 105 -9 114
Baltimore 107 -7 114
Chicago 107 -25 132
Dallas 113 -8 121
Denver 105 -25 134
Las Vegas 117 8 109
Los Angeles 113 24 89
Memphis 108 -13 121
Miami 100 27 73
Minneapolis 108 -41 149
New York 106 -15 121
Phoenix 122 16 106
Salt Lake City 107 -30 137
San Francisco 103 27 76
Seattle 103 0 103
St. Louis 115 -22 137

