In July we crossed over to top last year's monthly sales... in August sales went up again and we pushed ahead of last year's year-to-date sales.
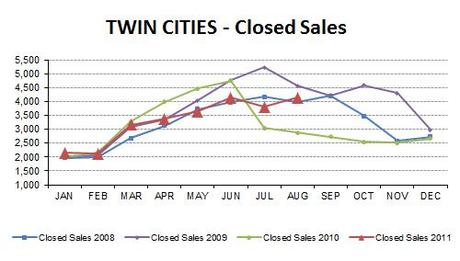
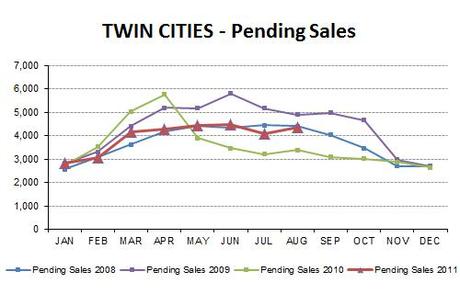
It is encouraging that not only did closed sales bump up... so did pending sales, which predict future closed sales. I know I have seen activity picking up again, hopefully a sign we continue to work our way back to 'normal' and will have a reasonable fall market.
The number of new listings also increased a bit in August, for the first time since March.
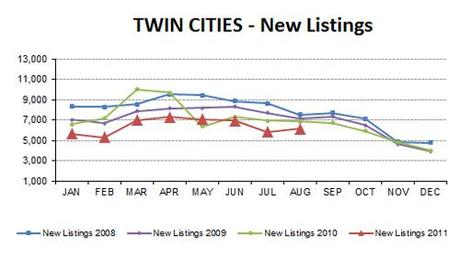
This slight increase in new listings wasn't enough to feed the increase in sales, however, and the total supply of homes for sale continues to drop. This could be good news for sellers as we move towards a balanced market. There was a 7.1-month supply of homes available for sale at the end of August, the lowest it has been since March 2010 at the height of buying frenzy before the end of the federal homebuyer tax credit. A balanced market is considered to be a 5-6 month supply.
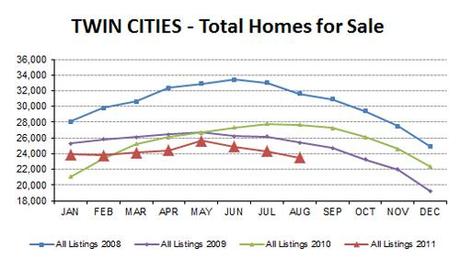
I find it interesting to look at the historical chart of the inventory of homes for sale below, compiled by the Minneapolis Area Association of Realtors. Note how we usually have seasonal 'humps' in the spring and summer... then note how small our 'hump' was this year. The peak supply hasn't been this low since 2006! The only reason we aren't in a buyer's market as we were in 2006 is because there aren't as many buyers as there were then... in spite of both mortgage interest rates and prices about 35% lower than they were in 2006!

These are encouraging signs, but sadly median price dropped again in August by 8.2% compared to last year. Single family homes dropped the least at 6.8%, townhomes dropped 14.3%, and condos dropped the most at 16.0%. The good news for the townhome market, however, is their months supply is the lowest of the property types with only a 6.2-month supply... that's pretty close to being balanced between buyers and sellers. That's probably because that's where the biggest supply of homes in the $120,000-$190,000 lies... the price segment where the supply has dropped the most.
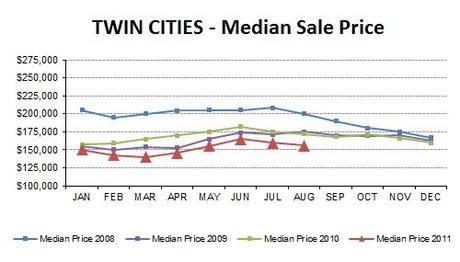
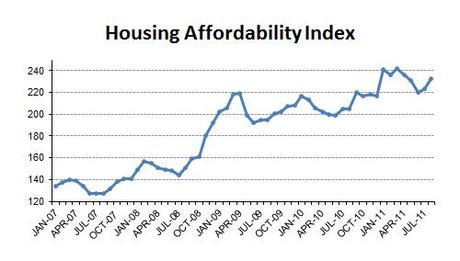
Prices combined with interest rates as low as 4.0% for a conventional loan and 3.75% for an FHA loan (!!) gave the housing affordability index a boost again this month.
Buyers seem to be hearing the call to the housing sale of the century... activity seems to be picking up again after the typical lull during the State Fair, Labor Day and back-to-school. We seem to continue on the slow path towards 'normal'.
The figures above are based on statistics for the combined 13-county Twin Cities metropolitan area released by the Minneapolis Area Association of Realtors. Click here for local reports on 200+ metro area communities. Click here for current interactive market analytics by area, city, county, neighborhood or zip code.
Sharlene Hensrud, RE/MAX Results - Email - Minneapolis - St. Paul Real Estate Market Information

