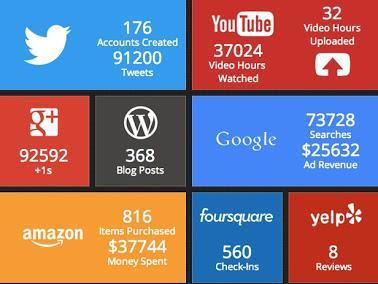
 No doubt about it, the Internet is big and lot of stuff is happening on it.
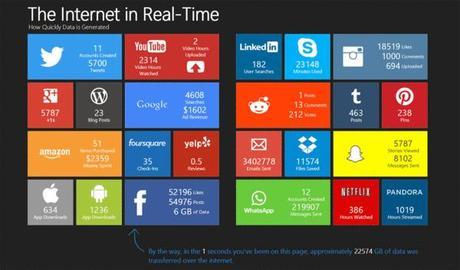
If you want to know more about data created on the Internet every second, this animated infograhpic called The Internet in Real-Time from PennyStocks puts things in perspective.
For every second, it shows: how many Twitter accounts are created; how many tweets are tweeted; how many hours of video are watched on YouTube and how many hours of video are uploaded to YouTube.
Furthermore, it also shows how many +1′s are made; how many WordPress blog posts are created; how many Google searches are performed; how much ad revenue Google collects; how many items are purchased on Amazon; how much money is spent on Amazon and how many check-ins are made on Foursquare.
This infographic also shows how many Yelp reviews are written; how many apps are downloaded from Apple’s App Store; how may Android apps are downloaded; how many Facebook likes and posts are recorded; and how many GB of data are added via Facebook.
Plus, it shows: user searches on LinkedIn; Skype minutes; likes, comments, and uploads on Instagram; posts, comments and votes on reddit; posts on Tumblr; pins on Pinterest; emails sent; Dropbox files saved; SnapChat stories viewed and messages sent; WhatsApp accounts created and messages sent; Netflix hours watched; and Pandora hours streamed.
The infographic is astounding, it gives you an idea of what is happening on the Internet every seconds. The Internet in real-time infographic is awesome.
Check out a three-second preview of the animated infographic below:

Click the animation to open the full version (via pennystocks.la).

