Good evening one and all,
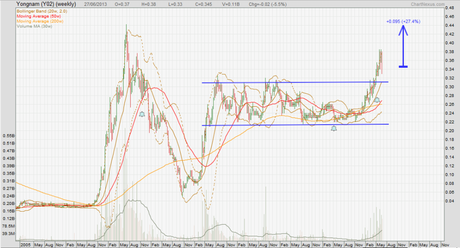
I have a chart of Yongnam, Y02.SI, for today. After recovering well from the 2008-2009 crisis, Yongnam traded in a range between $0.22 and $0.32 for a long time. In April of this year, Yongnam crept up and broke through 32 cents without much fanfare – though single-day spikes occurred once in a few weeks. Today’s close of $0.345 puts Yongnam about 25% from all-time highs. I like how Yongnam has decidedly stayed above the previous resistance of $0.32. Also, volume has been picking up at an increasing pace. It does seem like something may be up in Yongnam. As a chartist, I simply take the bullish signs I see on the chart. Whatever that is happening out there will manifest itself in price action (and volume). Let us see what Yongnam does next.

All analyses, recommendations, discussions and other information herein are published for general information. Readers should not rely solely on the information published on this blog and should seek independent financial advice prior to making any investment decision. The publisher accepts no liability for any loss whatsoever arising from any use of the information published herein.
