Despite all the media blow-harding about the “recovering” and “recovered” economy, it really doesn’t take an Einstein-level genius to read the two graphs below and realize that the U.S. economy is sick. Nor will it get better soon.
Click graphs to enlarge.
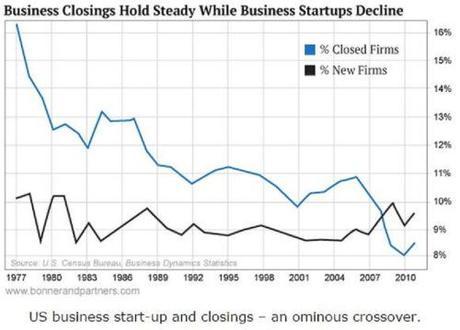
Graph No. 1: Capitalism is dying in America

The people who create wealth are vanishing.
Jim Clifton, the chairman of Gallup, reports that, for the first time ever, there are more US businesses closing than starting up:
“There continues to be a direct link between market cap (which measures the total value of all outstanding shares) and performance. The US now ranks not first, not second, not third, but 12th among developed nations in terms of business startup activity. Countries such as Hungary, Denmark, Finland, New Zealand, Sweden, Israel and Italy all have higher startup rates than America does.
We are behind in starting new firms per capita, and this is our single most serious economic problem. Yet it seems like a secret. You never see it mentioned in the media, nor hear from a politician that, for the first time in 35 years, American business deaths now outnumber business births.
The US Census Bureau reports that the total number of new business startups and business closures per year – the birth and death rates of American companies – has crossed for the first time since the measurement began.
I am referring to employer businesses, those with one or more employees, the real engines of economic growth. 400,000 new businesses are being born annually nationwide, while 470,000 per year are dying.“
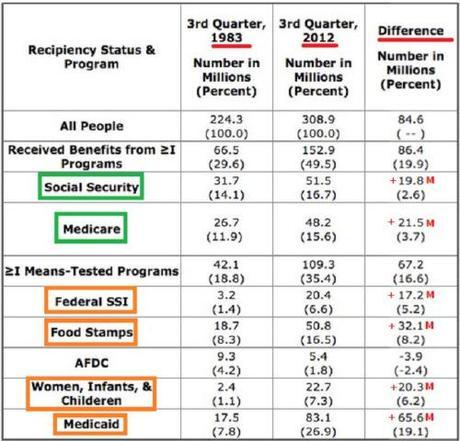
Graph No. 2: The Ever-Expanding Welfare State

At the same time as business startups are becoming an endangered species, the number of Americans dependent on the government are ever increasing.
The chart above, from American Enterprise Institute’s Nicholas Eberstadt, shows the alarming increase in just 19 years (1983-2012), in the number of Americans receiving:
- Earned (presumably) benefits: Social Security; Medicare.
- Outright welfare: Social Security Supplemental Security Income (SSI); Food Stamps; Women, Infants & Children; Medicaid.
In just 19 years, the number of people receiving:
- Social Security increased by 19.8 million (or 2.6%)
- Medicare increased by 21.5 million (or 3.7%)
- SSI increased by 17.2 million (or 5.2%)
- Food stamps increased by 32.1 million (or 8.2%)
- Women, Infants & Children increased by 20.3 million (or 6.2%)
- Medicaid increased by a whopping 65.6 million (or 19.1%)
Source: Zero Hedge
~Éowyn

