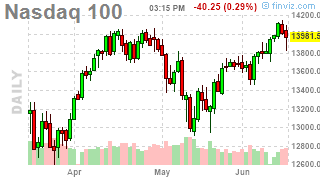
 14,000 on the Nasdaq.
We're actually over what we thought would be the top of our range as the P/E Ratio of the Nasdaq 100 crossed over 40 at 13,000 so 14,000 is more like 43 time the earnings of the stocks in the index but, when you think about it, that's pretty much a 2.32% return on your investment, which is the same as the yield on a 30-year note so, as usual, where else are you going to put your money?
There's the rub, of course because, if the Fed does raise the rates on bonds, they make them more attractive than stocks and that can quickly lead to the very market correction they are desperately trying to avoid. Still, inflation is clearly out of control with yesterday's PPI number coming in at 0.8% for May and a shocking 0.7%. Final Demand PPI, which measures change in prices received by domestic producers for goods, services, and construction (the price you actually pay for things) is up 11% year over year – a number that hasn't been seen for decades. At any other time in our Nation's history, this would have been considered a major economic crisis – now it's just Tuesday….
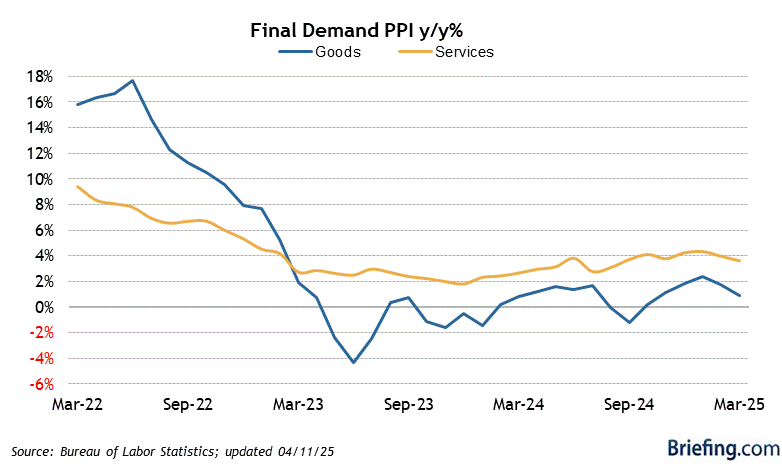
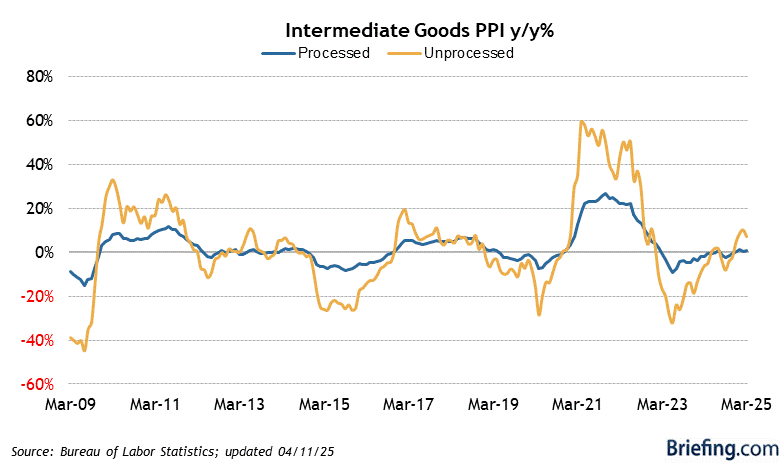
So far, the Fed has been swearing up and down that these inflationary indicators are "transitory" but there's no indicator of that at all. Rising prices for intermediate goods are a leading indicator, not a lagging one and we have yet to see the worst of this storm.
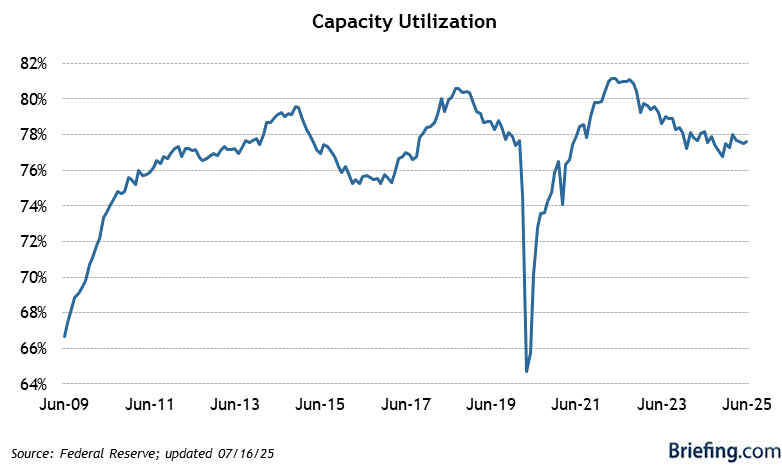
Not only that but Empire State Manufacturing for June was a miss at 17.4, down from 24.3 in May as Delivery Times lenthened to a record pace as inventories edged lower and "both input prices and selling prices continued to rise sharply." This is despite the fact that actual Capacity Utilization in our factories is still well below where we were before the crisis so, in general, we are procducing a lot less things for a lot higher prices – how is that a strong economy?
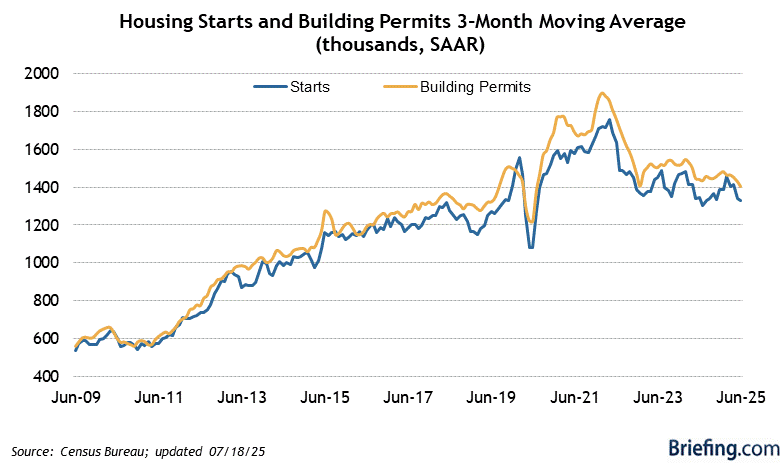
Building Permits were also down 3%, taking our leading Economorons completely by surprise and Export Prices were up 2.2% for the month, double the then-crazy 1.1% increase we had last month. These are numbers we usuall measure in 1/10ths! We'll see how the Fed interprets all this data later today with the rate announcement at 2pm and Powell speaking at 2:30, during our Live Trading Webinar – so this should be interesting.
Limited supply has been a recent driver of rising housing prices for renters and home buyers, alongside robust demand. The median existing-home price rose 19% from a year earlier to $341,600 in April, a record high, according to NAR. More than 90% of home builders surveyed by the National Association of Home Builders in May reported shortages of appliances and framing lumber. NAR is calling for a suite of policy responses to increase housing supply, including expanding the tax credit program for low-income rental housing, encouraging renovation of distressed properties and offering incentives to cities and states to reduce regulatory limits on housing density. The association also supports converting commercial buildings for residential use.
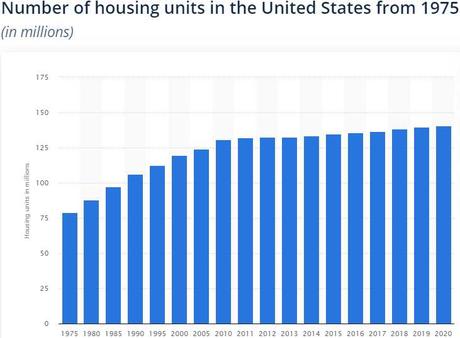
Basically, since the crash in 2008, we've added 10M homes to our inventory. The population grew by 23M people so it's really the exact same 2.3 people per home we had at the height of the property boom (308M people/130M homes) and everything the NAR is saying is just BS. Taking Government action to maintain the pace of home building at a rate that led to a collapse in the housing market is idiotic. That's why you have to be very careful when reading these "studies" – they can lead you, and your country, down a very wrong path…
Do you know someone who would benefit from this information? We can send your friend a strictly confidential, one-time email telling them about this information. Your privacy and your friend's privacy is your business... no spam! Click here and tell a friend!

