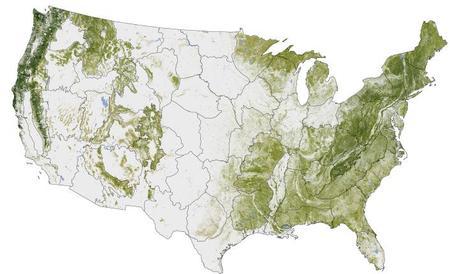
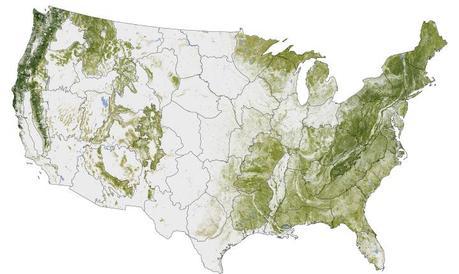
 Calling their work “possibly the highest resolution and most detailed view of forest structure and carbon storage ever assembled for any country,” the NASA Earth Observatory has released a map that includes measurements of about five million trees. With a scale of 30 meters, 4 computer pixels represents an acre of land. As the Earth Observatory states,
Check out the big map below to find out how dense the trees are in your part of the country. The old growth California redwoods, the oldest and largest living organisms on the planet, can be seen densely covering parts of the northwest. Also, you may find some areas of the U.S. more brown or green than you expected. According to the article above, “forests cover about 30 percent of the planet’s surface, and as much as 45 percent of the carbon stored on land is tied up in forests.”The map…was built from the National Biomass and Carbon Dataset (NBCD), released in 2011. It depicts the concentration of biomass—a measure of the amount of organic carbon—stored in the trunks, limbs, and leaves of trees. The darkest greens reveal the areas with the densest, tallest, and most robust forest growth. Over six years, researchers assembled the national forest map from space-based radar, satellite sensors, computer models, and a massive amount of ground-based data. They divided the country into 66 mapping zones and ended up mapping 265 million segments of the American land surface.

[Image]

