Evening all,
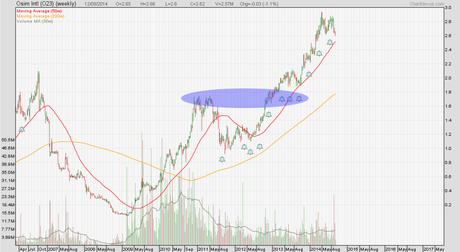
Pardon my inactivity for the whole year. I feel that my writing frequency has gone down like how my trading frequency has. In part, the local market threw me quite a number of surprises - but that is what money management and rational decision-making are for. US indices have recovered very strongly from the slight scare a few months ago, and other global indices have taken cue. Locally, the STI has drifted slightly higher, and continued strength will mean quite a good showing for the STI. My watchlist, however, shows a very mixed bag of performances by counters of different levels of market capitalization. Quite a while back, I got into Osim - O23.SI - when it was below $2.00; I posted a few articles during that time. As time passed, Osim kept climbing while financial reports posted positive numbers. Market sentiment was more or less like the chart - not much opposition and mainly praise. When "all sides" seem to agree with one another, it culminates in an easy trade to hold on to. I never had a reason to sell - so I did not.

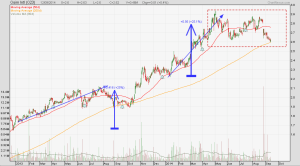
In the chart below, I set the data range from the start of 2013 to the present day. The last two years of Osim's stock performance are probably satisfactory to a trend-follower: steady up trend, small and mild correction, and a second leg of gains. Straightforward story, straightforward trade.
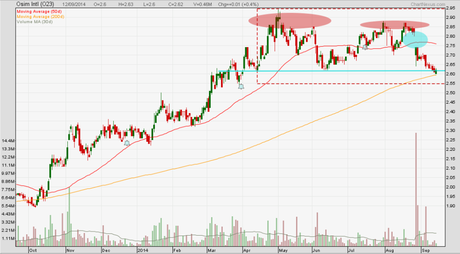
Only, Osim has started to tank: after hitting an all-time high of $2.94 in March, 2014, Osim has been trading sideways, and the latest trading session brought the 200-day MA into focus.

Strong resistance above $2.84 is born out of the failure to hold that level on numerous times - as highlighted in red. Taking a slightly macro view of the chart, I see two regions that look like the peaks of a simple double top formation. An interesting thing to note is that the 200-day MA is near the neckline of the potential double top formation (which is bearish, generally-speaking) (see if you can spot another one in the middle of 2013), which only serves as confirmation of further downside if Osim does not start finding support. A bearsh indication on the chart is an ugly gap (circled in aqua). The gap came with tremendous volume, and the selling does not seem to have stopped. The picture this year looks worrisome. Some upward movement may be expected since Osim is near a good support zone. After tanking for quite a while, I will consider Osim as flat, so I expect a small rebound. A few more weeks will give a better picture if the market thinks Osim is now trading at a fair range or if Osim should be priced significantly lower. Are the good financial results taking a turn soon? Some more time will give me a better idea. As for now, it does seem like I have sat on Osim for long enough.

