Good day all,
Highlight of the past week for traders: turmoil in Ukraine gives the stock market jitters; while gold boasts its allure since the start of the year. (Of course, positive payroll figures on Friday is also quite significant). Equities have officially recovered from the slump at the end of January since prices have either breached highs – a full recovery – or climbed up near to levels seen in early January.
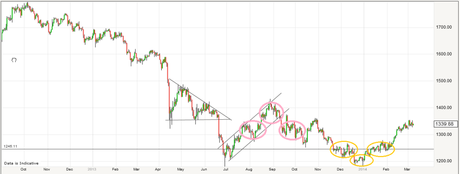
Gold has been making a stealthy ascent after a bearish showing last year. Last month’s trading saw gold edge into 1,300 territory - this level previously seen in November, 2013. In the chart below, you will see a few small to medium-sized patterns. The first pattern is a descending triangle. It is not the best triangle “on paper” since it has large spaces inside the triangle; however, you can identify where the bottom of the triangle – support – is at, and there are arguably three clear, lower highs. After a catastrophic collapse (if 10% does not warrant such a description, think about leveraged accounts), gold rose steadily to a high of just above 1,400. Then, the upward parallel channel was violated downwards, and gold formed a head and shoulders pattern. The right shoulder of the classic pattern is just outside the parallel channel. I have noticed such price action that links a channel with a head and shoulders pattern. After seeing many of such formations, my conclusion is that half the time the head and shoulders fails after a downward breakout – as in gold here; and the other half of the time the head and shoulders proves right and price continues further down after a breakout. This formation is difficult to trade because of the high chance of a whipsaw after the head and shoulders, but I still like to keep in mind how such formations pan out.

All that is not so relevant to gold now; what is relevant is that gold just came out of an inverted head and shoulders and has made tracks northward. News of unrest in Ukraine triggered old prospects of gold heading much higher in the year ahead. I see no reason for gold to put on “glittery shades of 1,700 an ounce”. Gold declined significantly for the whole of last year, and it is now in a range. Simply put, gold is consolidating after a huge move. Until there is concrete sign of a bottom established in gold, I see a lacklustre year ahead for this commodity. Clear-cut resistance is at 1,400, where a previous mid-term high is at.
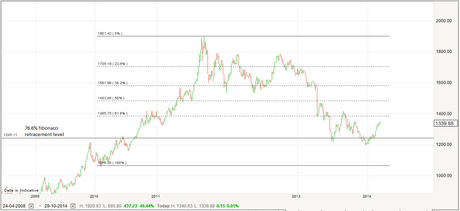
In the chart below, I included Fibonacci retracement levels taking the high as gold’s own all-time record at 1,900 (not exact in the chart), and the low as 1,000. I have had these levels on my chart of gold for several years. It is interesting to see that gold has been reactive to the 38.2% and 61.8% retracement levels. Currently, gold is consolidating in the region between 61.8% and 78.6%. The 78.6% level is not a popular level but my experience tells me that it is significant enough to be used.

All analyses, recommendations, discussions and other information herein are published for general information. Readers should not rely solely on the information published on this blog and should seek independent financial advice prior to making any investment decision. The publisher accepts no liability for any loss whatsoever arising from any use of the information published herein.
