
One of the most important data for an options trader is the implied volatility. The higher the implied volatility the higher would be the price of an option. But using the implied volatility as a naked figure has a weak spot. When you take a random stock and take a look at its implied volatility, would you be able to determine whether it’s high or low, especially compared with the volatility of the past? Actually, you wouldn’t. Maybe you would be indeed able to do this when you observe a stock for a longer period of time. But this would apply just to one stock and not to every stock or commodity. And here comes a solution which is called the Implied Volatility Rank or just the IV Rank.
What is IV Rank
To answer this question, it would be the best when you take a look on the chart. Let’s take a stock which everyone knows, for example, Apple. In the chart below we see the chart of Apple with the graph of the implied volatility which has a value of about 40%.
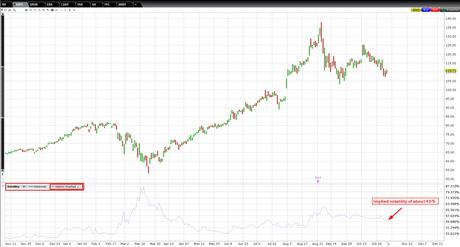
But the question is: is the value of 40% high enough and is it worth to sell options on Apple? Because when you take a closer look at the graph of Apple’s implied volatility, you will see that it was much higher in March which was during the Corona crash of 2020:
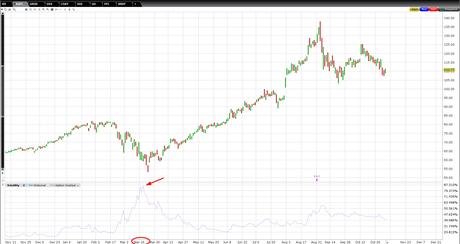
And here is the answer for the question “what is the IV rank”: the implied volatility rank is a metric which uses the actual implied volatility with past implied volatility helping to determine whether the current implied volatility is high or low.
Therefore, with this metric, you will get a much better evaluation if it’s worth selling an option, and that’s the advantage of the implied volatility rank.
To make this theoretical stuff more usable, let’s check the next section and take a look at an example.
How to use the implied volatility rank
Now let’s check how to use the implied volatility rank. For this, let’s check the chart again. In the chart you see the last 52 weeks of the Apple chart.
Within these 52 weeks we look for the lowest value and for the highest value of the implied volatility, and we see that the lowest value was about 17% in November. The highest value in the past 52 weeks was about 90% in March. And if you remember, we have a current implied volatility of about 40%.
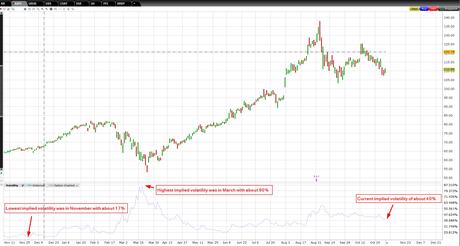
In the next step we need to find out, where is the current implied volatility of 40% located between the lowest value of 17% and the highest value of 90%.
To do this, we need to do a calculation, and the formula for this is:
IV Rank = (Current implied volatility – 52 Week Implied Volatility Low) / (52 Week Implied Volatility High – 52 Week Implied Volatility Low)
In our case the result would be: (40 – 17) / (90 – 17) = 0.31
The value of 0.31 corresponds with a percentage value of 31%.
So in our case, we have got an IV Rank of 31% for the Apple stock. But what does it mean? This means if you would draw a vertical line between the highest value of 90% and the lowest value of 17%, the current volatility of 40% would be located at the level of 31% along this line:

This was the manual calculation of the IV Rank, folks. But if you have the right broker, you will get this figure already calculated so you don’t need to calculate it manually:
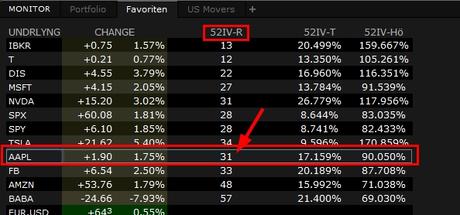
More about the brokers you will find at the end of this article.
When to sell options by regarding the IV rank?
In theory, you should sell options when the implied volatility rank shows high values. This is correct. But what is a high value? I know from some options traders that they are selling options only when the IV Rank of a stock hits the value of 50% or higher. The other ones are selling options also at lower IV Ranks. So in the end, you should find it out for yourself, for your personal mentality and your personal experience.
But what could help, is to determine the mean value of the volatility a stock made during a certain time. The reason for this is that the volatility is always tending to go back to its mean after it had hit the extreme low or high values.
Let’s continue with our example, folks, and check the volatility of the Apple stock during the last 5 years. And in this case, I will show you the historical (implied) volatility. When you check the 5 year chart, you will see, that Apple had the highest value of about 90% (March 2020) and the lowest value of about 12% (March 2017). So if we just take these two values and calculate the average value, we will get 51%.
So when we have a current implied volatility of 31% and in the last 5 years, the volatility had an average of 51%, it’s actually not worth to sell options.
I must admit, this is a quick and dirty method because to make it really precise, it’s necessary to consider every single day of the last 5 years. But in my opinion it’s not really necessary to know the exact mean value of a stock’s implied volatility because of one reason.
The reason for this is that it rather makes sense to work with the IV Rank as a quick estimation tool. Think about it, does it really matter if the IV Rank of a stock has an IV rank of 43% or 44% or for my sake 48%? In my opinion it’s not, because the IV Rank is just one puzzle of several and does not show you the whole picture as a stand alone metric. At least, it’s what my experience taught me.
Therefore, you should work with the IV rank as a tool you can use to determine quickly a position of the current implied volatility along the distance of the highest and the lowest value.
But in case you would like to have it precisely, you should work with another metric which is the IV Percentile.
Where to check the IV Rank and is there a free IV Rank scanner available?
Now as you have read this article to this point, you now might ask yourself: “Where can I find an Implied Volatility Rank scanner”? After all it would be great to have one so you can quickly detect stocks with a high IV Rank.
Free IV Rank Scanner
Well, at this moment, there are only few free sources available on the internet. Indeed, there is just one free usable source available which you will find on marketchameleon.com. But this doesn’t mean that this free source will be the only one in the future because they come and go as they want. That’s the characteristic of free sources…

Where to see the IV rank
In all other cases, when you don’t need an IV Rank scanner, you should see the IV Rank in the trading software of your broker. At least, these brokers are offering the IV Rank in their trading platforms:
Interactive Brokers (also Captrader)
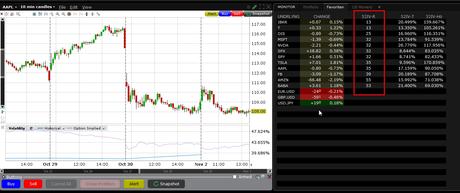
Interactive Brokers with its Introducing Broker Captrader offers the IV Rank in its trading software Trader Work Station (TWS). The only prerequisite for this is that you turn the software from the classic layout into the mosaic layout. Then you can start to add the IV Rank column.
TD Ameritrade
TD Ameritrade is another broker I know that they offer the IV Rank in their trading software thinkorswim.
I don’t have a trading account at TD Ameridrade because I am using another broker for years and I got used to it. But from time to time I was also using thinkorswim as a trial version, and that’s why I can say, thinkorswim is also a good platform you can use, not only for the IV Rank.
For instance, this software does offer tons of features but if you like to code, you can write your own code to get your own features, for example to plot an IVR chart.
But the prerequisite here is that you get a real trading account. When you try the paper trading account, the IV Rank is not available then. And that’s why I cannot show you a screenshot of this feature within thinkorswim, folks.
By the way, there an oddity in thinkorswim – you will find the IV Rank not as IV Rank but as IV Percentile which is actually a different metric. But thinkorswim offers a possibility to verify the formula used for calculation. When you check it, you will see that’s actually the formula for the IV Rank and not for the IV Percentile…
Tastyworks
A great platform I know that they offer the IV Rank. Another feature you will get when you open a trading account at tastyworks is a kind of an IV Rank scanner which looks like a grid page:
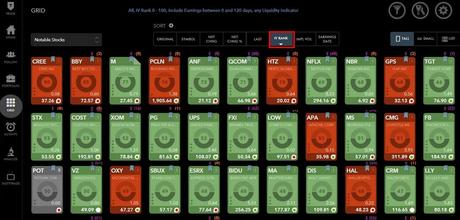
But also without this grid page you will find the IV Rank for every stock you will find in tastyworks.
Originally, tastyworks started under a different name and under a different website called dough.com. Back this time you could open an paper trading account within minutes and use this grid page for free. But later, when tastyworks started, it was not possible anymore to register on dough.com to use the paper trading with the IV Rank grid page.
I also don’t have a tastyworks account. But I liked this grid page on dough.com a lot, and I can really recommend you to open a tastyworks account in case you are looking for a trading platform.
Okay folks, that’s it about the sources. There are for sure other trading platforms offering the IV Rank but with these three ones, you should have a good starting point. And with this I think, you should get the answer for the question “Where can I find an Implied Volatility Rank scanner?” Now let’s continue with the last section where I will show the weak spot of the IV Rank.
Disadvantage of the IV Rank
Let’s talk about the weak spot of the IV Rank, folks. This metric is a pretty good tool if you would like to determine quickly, if a stock’s implied volatility is high or low to make a desicion whether to sell options or not. But there are situations where the IV Rank shows you “wrong” values. It happens usually then when the implied volatility spikes and produces outliers. In this case, you will get diluted IV Rank values for a longer period of time, at least for the next 52 weeks.
In this case it would be great to have a possibility to determine whether the IV Rank shows actual values or misleading ones. That’s why there was another metric introduced which is called the IV Percentile and you can read about it by clicking here.
Advertisement
Would you like to know how to profit from crashes in the stock markets? Then check this preview and enroll this course on Udemy.
Disclaimer: The information I am giving you in this article is for educational purposes only and should not be treated as investment advice. The information presented would not be suitable for investors who are not familiar with exchange traded options. Any readers interested in trading activities related to the information in this article should do their own research and seek advice from a licensed financial adviser.
