When you want to trade with options, it’s crucial that you get familiar with the term implied volatility as this metric is one of the most important tools you need in options trading. The reason for this is that disregarding implied volatility can lead to “unexplained” losses, even though the trade idea itself should have work out. Usually, beginners have some problems to understand this concept. But if you deal some time with this, you should be able to understand this whole topic and answer the question what is implied volatility. In this article I’ll give you a brief introduction about this metric.
What is implied volatility
Before we answer this question, we should first answer the question “what is volatility”. This one is really easy to explain and to understand. When you take a look on a chart of a random stock or commodity, you will see, that its price moves up and down. In other words: the price is swinging. These movements or swings are called volatility. To explain it in other words: volatility is the fluctuation range of prices of a security (stock, currency, futures contract, etc.). That’s it.
The explanation I’m giving you in this article is a simplified and a general one. But when you are looking for answers like what is implied volatility, I assume that you are a beginner. And when I’m giving explanations to beginners, I try to deliver as simple explanations as possible. The reason for this is that there was a time when I was also a beginner. And I was usually disappointed how the information was presented for beginners looking for educational information. At least for me, it was rather confusing than understandable.
But when you understood my simple explanation about what volatility is, you can start to dig deeper. For volatility can be more specified with such terms like actual volatility, historical volatility and also implied volatility. The last one I’ll explain you now because it’s one of the most important metrics for option sellers.
I explained you that volatility is a description for price movements or the fluctuation range of prices. Now imagine, you would like to sell an option for a stock today. The question is, how strongly will the price of the stock swing tomorrow, the next week or the next month? In other words, how strong or weak will be the volatility tomorrow, the next week, the next month, etc.?
And that’s actually already the explanation of what implied volatility is. It’s the expected fluctuation of the prices of a security in the future. That’s it.
Again, this explanation is a simplified one for beginners. There is much more to explain about implied volatility. And if you would like to know a bit more about it, then continue with the next section folks.
Implied volatility and options trading
As I mentioned, implied volatility is one of the most important metrics for option sellers. To be more exact – every option seller is looking for a high implied volatility. The reason for this is simple, the higher the implied volatility the higher the premium an option seller would get.
There are can be several situations implied volatility could rise or fall. As you have learned, implied volatility represents the expected fluctuation of prices of a stock, currency, commodity, etc. When the market participants expect a higher fluctuation range, they are willing to pay more money for option sellers. One example for an expected higher fluctuation range of prices is the time before earnings announcements.
When stock companies are publishing their quarterly earnings, a lot of stocks can be very volatile. And there are a lot of professional traders are looking for protection from losses because they expect higher fluctuations (volatility). And as options were designed to protect from losses (hedging), professional traders are buying options before the earnings announcements. During this time, they are willing to pay more money to option sellers than usual.
Reading this, you might want to know how implied volatility is calculated and where to check it. Let me explain it in the next section, folks.
How to measure implied volatility
As implied volatility is just an expected volatility (or a guessed one), it would be good to know how this expectation is calculated. But the thing is that’s it cannot be just calculated. The reason for this is that you would need to interview every market participant to have an exact calculation of implied volatility. Therefore, the implied volatility can only be calculated indirectly as a part of a formula.
This formula is the best-known formula for calculation (or estimation) of the fair value of an option. The name of this formula is “Black-Scholes-Formula” and it was developed by three economists – Fischer Black, Myron Scholes, and Robert Merton in the year 1973.
This formula is pretty complex to make a calculation manually, and for a Call option price it looks like this:

For a put option the formula looks like this:

I will not explain every single element of the formula because I think, this would be out of place. But you just can read this article on Wikipedia for detailed information.
As you can see, you cannot just “calculate” implied volatility because it’s the part of the Black-Scholes-Formula, and it’s actually something that comes out of all the other variables of the Black-Scholes-Formula which is telling us something about the perceived volatility in the future. But luckily, you don’t have to do this because every decent trading software offers a plot of implied volatility.
For instance, in Captrader’s “Trader Workstation”, the plot of implied volatility looks like this:

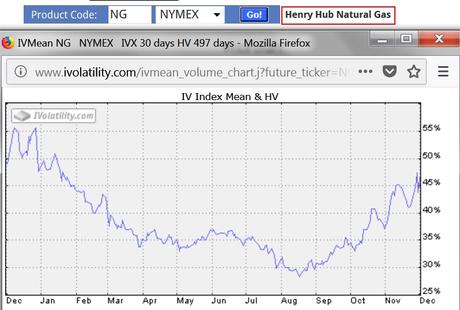
But if you don’t have a trading software and would like to know the implied volatility nevertheless, you can also use some services like ivolatility.com. I was using the service of ivolatility when I was trading options on futures, and I have some screenshots left. On the screenshot below you see for instance, the implied volatility plot of natural gas:

Implied volatility and the first standard deviation
Standard deviation? What the heck is that? In this section we will delve a bit more into the topic implied volatility, folks. Why? Because if you want to become a successful option seller, it’s crucial that you understand the concept behind implied volatility.
Again, as this article is for beginners, I assume that you never heard about terms like standard deviation. Therefore, I’ll try to explain it as simple as possible to make it understandable. Later, when you understood the basics, you can delve deeper into this topic by checking books about statistics or just Wikipedia.
When a security price swings up and down, it leaves a fluctuation range of prices. Implied volatility is an expected fluctuation of those movements. But when you know the implied volatility, it would be also great to know the range where the fluctuation usually happens. And it would be great to know, which areas a stock price most likely won’t arrive.
And that’s where the standard deviation comes into play. With a standard deviation you can determine a percentage range within a stock price statistically should stay.
There is a one, two and three standard deviations.
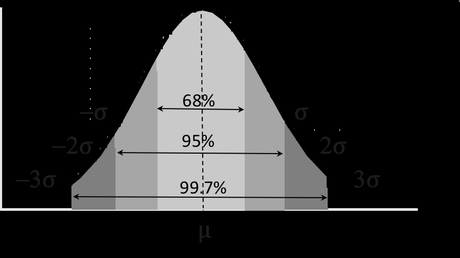
The one standard deviation is telling us that a price of a stock will stay within a specific range with a probability of 68%. Why 68%? Well, it’s just a result of a statistic calculus. If something is normally distributed, then approximately 68% will fall into this range which is called one standard deviation.
Two standard deviations mean that a security price will stay within a specific range with a probability of around 95% and with three standard deviations you will get a probability of around 97%.
In statistics, there is usually this graphic used to show the standard deviations visually:

This visualization is also called the normal distribution or Gaussian distribution.
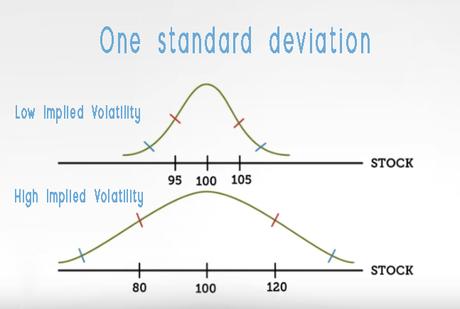
In the world of options, a lot of professional traders are using this concept of normal distribution to determine the one standard deviation. As the one standard deviation has a probability of 68% that the stock would stay within a certain range, the traders are choosing the “borders” of the range as the price level where to buy or sell options. These price levels they choose are called a strike.
So how does the implied volatility affect the standard deviation? Well, the higher the implied volatility the wider is the range of one standard deviation.

This means that option traders, especially option sellers can choose strike more far away from the actual price.
Last but not least: historical volatility
To make this article complete we should check the counterpart of implied volatility which is historical volatility. This term or metric is not a rocket science at all. While implied volatility is the expected volatility of “tomorrow”, historical volatility is the volatility of “yesterday”. That’s the whole secret, folks.
Usually, historical volatility is lower then the implied volatility. The reason for this is that market participants usually expect the worst and willing to pay more than an option is really worth. Which is good for us, the option traders. Yey!
Okay, folks, that’s it. Please note that this was just a brief introduction about implied volatility. If you want to become a successful options trader, you need to delve a bit more into the whole topic. For example, you should also know, hat implied volatility comes into play when you want do know about the IV Rank of a security.
Advertisement
