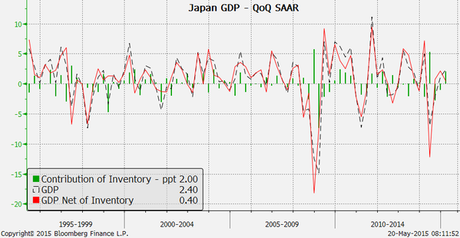
 Japan grew 0.6% in Q1.
That's a 2.4% annualized growth rate but, of course, that's priced in Yen, which are down 14.8% since last year so, in fact, Japan's economy, in Dollar terms, is losing 12.4% from last year. This is not the headline you'll hear in the MSM though, where the overwhelming message is "Don't Worry, Be Happy" and, in fact, Robert Shiller just wrote an article telling people to cheer the F'ck up to avoid a Depression.
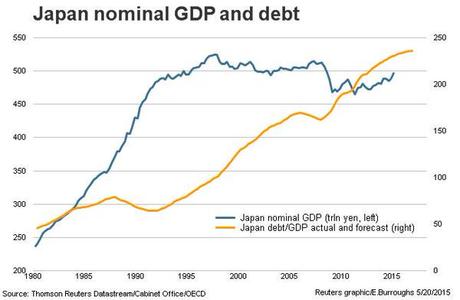
As you can see from the chart above, adding 80Tn Yen worth of debt in the last 5 years has only added 25Tn Yen worth of GDP and the current 495Tn Yen GDP is still well below 2007's 505Tn Yen and, at the time 505Tn Yen was worth $5.5Tn but now, 495Tn Yen is only worth 41.25Tn so, in Dollar terms (or any steady currency), the GDP of Japan has actually DROPPED 25% since 2007 and this quarter's "boost" of 0.6% comes on the back of an additional 5% drop in they Yen since Q4 of last year.
Yet no one will mention this in the MSM. Why? Well first of all it's complicated and even NYTimes readers' eyes glaze over when you start doing math. Secondly, it doesn't fit the narrative that our Corporate Masters want you to swallow – that QE is working and more QE is better and all that matters is that the stock market goes up and everything else will be fine.
I ranted about this in yesterday's Live Trading Webinar and you can watch a replay of that HERE, so I won't get into it again. We also made $100/contract live trading the Russell Futures and our bullish trade on Gasoline Futures (/RB) that we played into the close is already up $1,000 per contract this morning as /RB is back over $2.02 already (you're welcome).
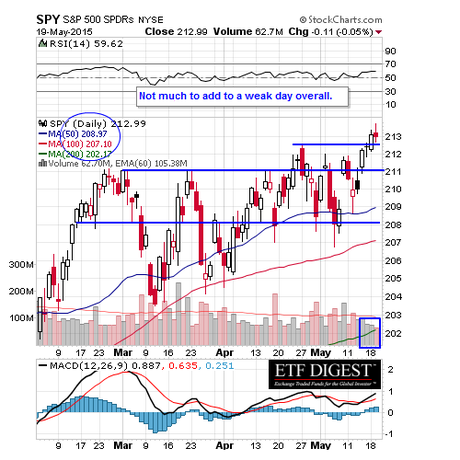
1,884 stocks on the NYSE declined yesterday while 1,270 advanced but the algos know how to hold onto the right stocks until the bitter end in order to paint a pretty picture while they dump their shares and the TA people eat it up because very few of them take volume or money flows into account – they just follow the squiggly lines and look for patterns like a high-stakes Rorschach test.
We are not bearish on the markets – who can afford to be bearish in this QE environment? What we are is mainly in cash and sitting on the sidelines, waiting to see if the bulls really have some more gas in their tank. As we noted yesterday in our live review, our Long-Term Portfolio is at $753,467 but it has $770,090 in cash. That's 102% in CASH!!! That happens because we are BEING THE HOUSE – Not the Gambler, and we're SELLING premium as a primary strategy.
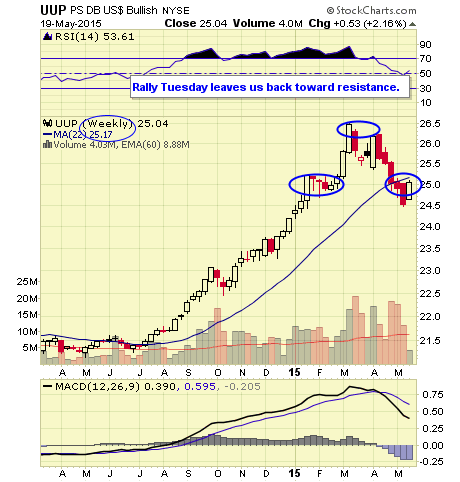
Mostly we like cash because of the flexibility it affords us. I noted some of the trade ideas we've acted on recently in yesterday's post and we even went bullish on the S&P (SPY) on Monday but, after a very nice gain – we were back to shorting it yesterday and did very well with our /ES shorts (S&P Futures).
The bullish SPY trades still make a nice hedge against our cash becoming less valuable (relative to stocks) but we still have our inflation-fighting plays in the Long-Term Portfolio, which also perform the same function. With next week a short holiday week and this week ultra-light trading into the holiday weekend – I don't see any reason to get off the sidelines until probably Tuesday, June 9th – so don't expect much action between now and then.
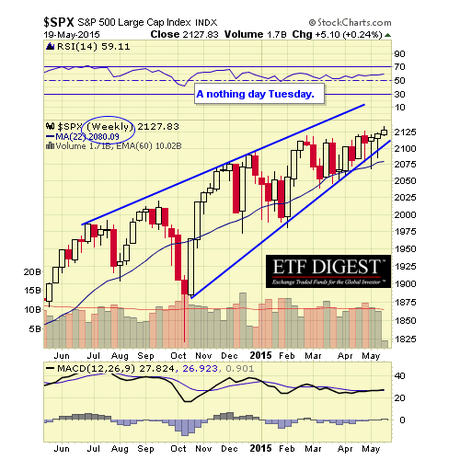
That's a very mild pullback and, as you can see, 2,070 already formed a bit of a base on our first run to 2,128, but the weak volume on this run up leads us to think we need a good drop back before we're ready for a real breakout to the 20% line (2,220).
That means that, between now and June 9th, we can use the following levels to determine whether or not we're breaking out to new highs (3 of 5 green is bullish, 3 of 5 red is bearish):
Dow 17,600 19,360 20,240 21,120
S&P 1,850 2,035 2,128 2,220
Nasdaq 4,000 4,400 4,600 4,800
NYSE 11,000 12,100 12,650 13,200
Russell 1,200 1,320 1,380 1,440
Ouch! Well that puts things in perspective, doesn't it? Turns out that the S&P is the only index, other than the AAPLdaq, to punch even 10% over our lines and, in fact, we're still waiting for the Dow to show us the money at 18,480 (+5%) along with the NYSE (11,550) and the Russell (1,260) so, on the whole – it's not all that impressive after all.
And keep in mind, these are the highs we're hitting AFTER Trillions of Dollars have been pumped into the Global Markets. What will ever happen if those supports are ever removed?
Be careful out there!
Do you know someone who would benefit from this information? We can send your friend a strictly confidential, one-time email telling them about this information. Your privacy and your friend's privacy is your business... no spam! Click here and tell a friend!

