As you can see in Dave Fry's DIA chart, we're still having trouble with 13,600 – same as last week. We did a full analysis of the Dow components in last week's post so we were ready for yesterday's action as I said to our Members in Chat at 10:28:
Volume very low on this rally – just 29M on the Dow at 10:26 so hard to say anything we see is significant – maybe just short-covering on that ISM report so let's grab 30 DIA weekly $137 puts for $1.60 in the $25KPs while they're cheap with a stop at $1.40.
We also (gasp!) shorted AAPL and sold some long QQQs in subsequent comments (10:32 and 10:34) and we took $2.05 and ran on the DIA puts at 1:24, when we made a well-timed, non-greedy exit (up 28%). We could have done better if we had held them into the close as they finished the day at $2.30 but we were bottom-fishing by then and had flipped long for the overnight as the sell-off seemed a bit silly, what with the Chairman of the Federal Reserve telling us:
“We expect that a highly accommodative stance of monetary policy will remain appropriate for a considerable time after the economy strengthens.”
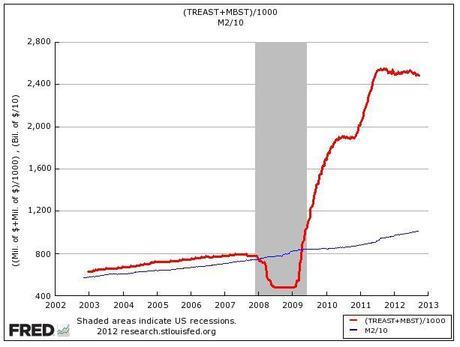
 As I said last week – even if we want to assume that continued money-printing by the Fed is only 25% as effective as it has been for the past 3 years (chart on left is expansion of Fed Balance Sheet and the Money Supply divided by 10 (so it fits)) - the S&P is up 116% (from 666) since March 9, 2009 and Bernanke is telling you – over and over again – that he will keep up this market-pumping policy for AT LEAST 2 more years. So maybe we don't gain 30% a year, maybe it's "only" 10% – that's still taking us to S&P 1,747 in 2015, Dow 16,353.
Like it or not, that's our market reality. "God, grant me the serenity to accept the things I cannot change, the courage to change the things I can, and the wisdom to know the difference" is AA's "Serenity Prayer" and we at PSW are trying to take it to heart and ignore those pesky fundamentals and ACCEPT the free money – because it's NOT going to stop – not for a long time…
That money supply is up from $8Tn to $10Tn in the past 3 years and it's all from the Fed – who expanded their balance sheet by just under $2Tn. The trick is, this is the M2 Money Supply, which measures only money in circulation – NOT large time deposits, institutional money market funds, short-term repurchase and other larger liquid assets. In other words, M2 does not measure the money held by rich people and, since 2006, M3, which used to measure those things, is no longer tracked by the US. Why? Because, unless you were Mitt Romney rich – you'd probably be outside with a gun right now hunting for rich people.
 Since the Bush Administration pulled the M3 measurements, the top 1% have captured 93% of the income growth in this country. Even funnier, the bottom 80% saw their earning drop over the same time period. Last year alone, earnings for the bottom 93M families (those making less than $101,583) FELL 1.7% while the top 1% (1.2M families) GAINED 5.5%.
The earnings gap between rich and poor Americans was the widest in more than four decades in 2011, Census data show, surpassing income inequality previously reported in Uganda and Kazakhstan. The notion that each generation does better than the last — one aspect of the American Dream — has been challenged by evidence that average family incomes fell last decade for the first time since World War II.
 The patterns reflected by the two recoveries may consign the U.S. to slow growth for years, said Nobel Prize-winning economist Joseph Stiglitz, who explored the income gap in his 2012 book, “The Price of Inequality.” Depressed earnings lead to lower consumption, which stems job growth and keeps the risk of recession high, he said. “We’re all in the same boat, if our economy doesn’t go well, the 1 percent will suffer.”
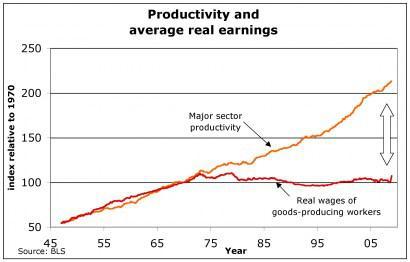
From 1979 to 2007, about $1.1 trillion in annual income shifted to the top 1 percent of Americans — more than the entire earnings of the bottom 40 percent, according to Alan Krueger, chairman of Obama’s Council of Economic Advisers and an economics professor at Princeton University. If income were distributed as it was in 1979, there might be $440 billion in additional spending each year — a 5 percent boost to consumption. The chart on the left clearly indicates what's going on – workers no longer get paid for what they produce – wages have become disconnected from productivity. An honest day's work gets you an honest day's pay – from 1973!
 All those excess profits are simply funneled into the pockets of the "job creators" – that's right, let's call them job creators because if I can make people work for half of what they are worth and pocket all the wages I'm stealing – I'll create as many jobs as I can find suckers to fill them too! These "job creators" are "wage stealers" and there has been a massive, coordinated effort in this country to wipe out unions and roll back labor reforms by the "job creators" all aimed at paying the workers as little as possible while they make as much as possible.
I'm sure many of our Conservative readers are saying that's "fair" but if that's fair, then why not hire some overseers – give them guns and force the workers to work for no wages at all? It's just as "fair" – it's just our new negotiating position. If they won't do it, maybe we'll go find people in other countries who will. We'll send some boats over to pick them up. That's right, America is just one step away from going back to slavery – that's how successful the top 1% have been in rolling back 200 years worth of progress for the working class.
Despite Bernanke's protests to the contrary, these are deep, systemic flaws in our economy and they aren't going to be fixed by trickle-down economics (talk about a policy that has failed for 40 consecutive years!). Free money and the promise of more free money is the ONLY reason we're bullish on the markets – you do NOT want to be around when this punch bowl goes away and people begin to sober up but, for now – call us market optimists…

