When the world is running down
You make the best of what's still around – Police
This is the chart we'll be watching today:
It's Dave Fry's McClellan Oscillator and -100 is very, very oversold so we can expect some kind of bounce for any silly reason and what we'll be watching closely is how fast a move up works off the oversold condition. If, for example, we come back 13 points on the S&P (weak bounce) to 1,658 and the Ocillator moves all the way back to 0 (neutral) - then the market is likely due for much more pain ahead.
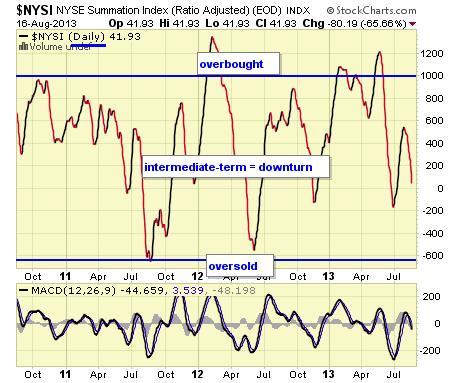 It's not enough to just stare at the charts – you need to understand HOW they are constructed and what factors affect them. On the left is the NYSE Summation Index, sort of a longer-term oscillator and it's showing we're not even oversold yet. This makes it very likely that any bounce we get today will be short-lived and I've already sent out an Alert to our Members (and a tweet) to prepare for stormy weather ahead.
I won't get into the macros again – you can follow the links for that – since I sent out the Alert we had a beat from Best Buy (BBY) and Home Depot beat and raised guidance so that's given us an excuse to bounce higher but also gives us a chance to pick up some inexpensive hedges but, first, our target levels.
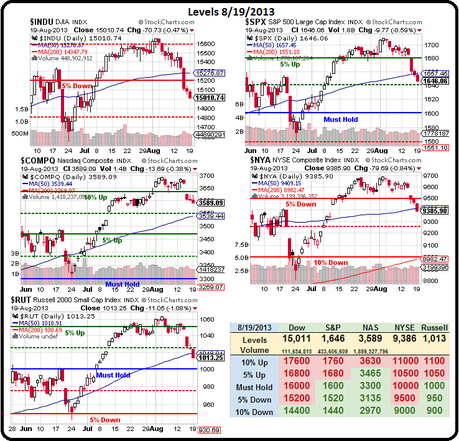 Per our 5% Rule™, we look for weak (20%) and strong (40%) bounces off 1.25%, 2.5% or 5% market pullbacks. The S&P, for example, fell from 1,710 to 1,645 and that's 65 points or 3.8% or close enough to 3.75% to make us look at the legs and leg one was 25 points over 8 days, to 1,685, and leg 2 was 40 points over the last 3 days – so we've been accellerating to the downside.
At the 3.75% line, we expect a 20% retrace as "normal" and not a break of the trend. A 40% retrace (strong bounce) is a sign of possible strength and would be confirmed by a move over the 50% (of the drop) line. Usually, we track our 5 major indexes and look for 3 of 5 to confirm:
- S&P 1,710 to 1,645 is 65 points (3.8%) and we'll look for a weak bounce of 13 to 1,658 and a strong bounce of 26 to 1,671
- Dow 15,650 to 15,000 (strong support) is 650 points (4.1%, but notice the symetry with the S&P caused by Bot trading) and that makes the weak bounce +130 to 15,130 and a strong bounce +260 to 15,260
- Nasdaq is our most unreliable indicator as it's easily distorted by a single stock (AAPL) but 3,700 to 3,600 is 100 (2.7%) and a weak bounce of 20 takes us back to 3,620 and a strong bounce of 40 would be 3,640 before we're impressed.
 You may, at this point, be saying "but the Nasdaq is at 3,589." That's because we use our stronger, whole number supports and resistances when they are "close enough." The Nasdaq already blew it's support but that doesn't mean it's not there. There's a bit of art to the 5% Rule that includes throwing out spikes and averaging peaks and troughs thats been the subject of many other posts!
- NYSE fell from 9,700 to 9,400 and that's 300 points (3.1%) and 60 points bounces us to 9,460 and another 60 is the strong bounce at 9,520 but that 9,500 line is our -5% line on the Big Chart – so that's what we'll be looking for as a bullish sign (as we discussed yesterday, when they failed it).
- Russell has been our fastest mover to the downside, falling from 1,060 to 1,010 and that's 50 or 4.7% so right about our 5% Rule and that makes 1,020 weak and 1,030 strong but we won't be impressed until they take back 1,050, which is 5% over our Must Hold line at 1,000. If you're going to lead, then LEAD!
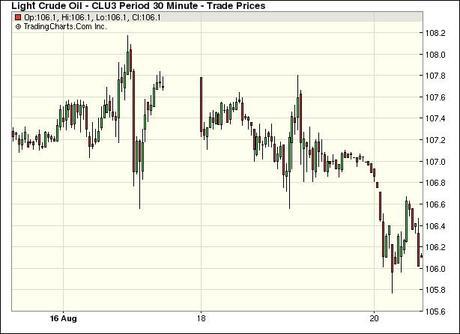 Needless to say, I'm not too enthusiastic about our chances. As I noted in our Alert, the Global markets are melting down and ignoring those signs in 2008 was not a smart move for anyone. We're still waiting for the other shoe to drop on oil but our USO puts are October for a reason – we thought it might take a while for oil to get real back below $102.50 (now $106.50 on the October contracts).
Still, I just told you on Friday that we liked the short at $107.50 on the 104,612 remaining September barrels because Tuesday (today) was the last trading day and here we are on Tuesday at $106 (so far) for a nice $1,500 PER CONTRACT gain in 5 days. Who loves you baby?
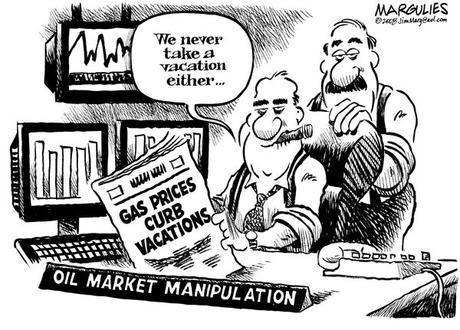
It's actually sad that we can make these predicitons but we can BECAUSE IT'S JUST A GIANT SCAM! It's fixed. The only point of NYMEX trading is to screw US Consumers out of hundreds of Billions of Dollars each year by inflating the price of oil which, in turn, drives up the price of all the energy you consume. It's dimes and quarters at the pump but it all adds up and you Congressmen don't do anything about it because Big Oil pays their bills. So what can we do other than go along for the ride?
Click for
Chart
Current Session
Prior Day
Opt's
Open High Low Last Time Set Chg Vol Set Op Int
Sep'13
106.93
107.10
105.77
106.19
08:08
Aug 20
-
Oct'13
106.72
106.91
105.51
105.95
08:08
Aug 20
-
Nov'13
105.80
106.06
104.73
105.27
08:08
Aug 20
-
Dec'13
104.64
104.73
103.48
104.04
08:08
Aug 20
-
Dec'14
93.57
93.57
92.75
93.32
08:11
Aug 20
-
Out of almost 400,000 open contracts indicating TOTALLY FAKE demand for 400,000,000 barrels of oil for September delivery, all but 30,440 have been cancelled or rolled over (to simulate demand in the next month) since July 20th (the previous rollover date), when oil was at $108 and there were 387M barrels worth of FAKE orders in September. Oct was only 131M at the time, Nov was 83M and Dec 205M for a total of 601Mb of FAKE orders for the front 3 months.
 Now we have Oct, Nov and Dec adding up to 729M FAKE orders with 92% of the September contracts cancelled and, despite the added BS, oil has falllen to $106 this morning so, if you didn't believe me for the last $2,000 per contract gain – perhaps you will for the next or perhaps you'll follow our USO, SCO and Futures trades in Member Chat or, better yet – perhaps you will write your Congressmen and tell them to put a stop to this BULLSHIT!!!
It's a CRIME folks – it's economic TERRORISM and you, my friends, are the victims – every time you go to the pump or to the grocery store or to your mailbox to get your gas and electric bills. Sure, we can make a lot of money playing the crooked game but it's destroying our country to line the pockets of the top 0.01% who control the IBanks and the Oil supply. And, I keep saying it but no one will believe me until it's too late – these same bastards are after your water next. Even now, they are contaminating a large portion of our supply with fracking – but that's another post…
I promised a hedge idea for the morning post and, as noted above, it's the Nasdaq that's dropped the least. Yesterday, in Member Chat, I put up the following trade idea for our Members on SQQQ at 11:22, when the Nas was spiking:
I think the SQQQ Sept $23/24 bull call spread at .40 makes a nice hedge. It pays 150% at $24 and you can sell the Sept $21 puts, now .23, for at least .30 if SQQQ fails $23 (now $23.44) so it's a good little short-term hedge to see if this Nas rally holds a day or not as it can easily be adjusted to a longer-term hedge. As we're already bearish in the STP, it's not a good add there, but I like it.
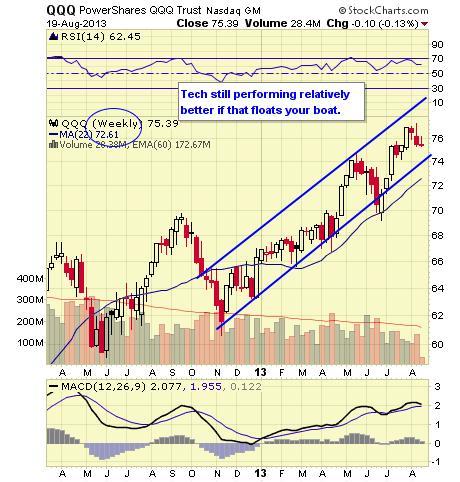
 The bull call spread, by itself, requires no margin and makes 150% profit in 31 days if SQQQ closes over $24. It closed yesterday at $24.04 and the net on the spread shot up to .50, for a 20% gain on the day when the Nasdaq only fell from $75.49 to $75.35 for the day (0.2%) so it's 100:1 protection! You don't need to invest a lot in a hedge to stave off damage from a downturn – especially if your long positions are sensibly hedged in the first place…
Keep in mind you can layer that hedge over and over and over, for each Dollar the SQQQ (ultra-short Nasdaq) ETF rises and that's what we can do as active traders in our daily chat room. For a more passive hedge, you can go longer in time, perhaps playing the SQQQ Oct $23/26 bull call spread for $1, which is currently $1 in the money and makes 200% if SQQQ hits $26, wich is up $2 (8.3%) so a 4% drop on the Nasdaq, to 3,445 ought to put you in the money.
Getting paid 50x more (on a percentage basis) than the Nasdaq drops is what we call "a good hedge." You can even offset that hedge by selling something (preferably on the Nasdaq) that you REALLY want to buy if it drops 20% – like AAPL 2015 $400 puts for $26. Selling one put for $2,600 buys you 26 of the bull call spreads and those return $7,800 if the Nasdaq falls. If the Nasdaq takes off – it's not very likely AAPL drops and, if the Nasdaq drops and AAPL falls again – then your worst-case is you own 100 shares of AAPL at $400 ($40,000), more than a 20% discount from where they are now ($507).
That's another trick of a good hedge – make your "worst case" something you'd love to have anyway!
We'll have plenty more in Member Chat today – be careful out there….

