It sure is for those of us in the top 1% (1.4M) - people earning over $352,000 in annual income. We made $105,637 more Dollars in 2010 than we did in 2009 – thanks in large part to the Fed's fantastic policy of printing more and more money, which lets us borrow cheaply or invest with leverage in inflating equity as the Dollar collapses. Sure the Dollar collapsing hurts everyone – but an extra $105,637 keeps us ahead of inflation, right?
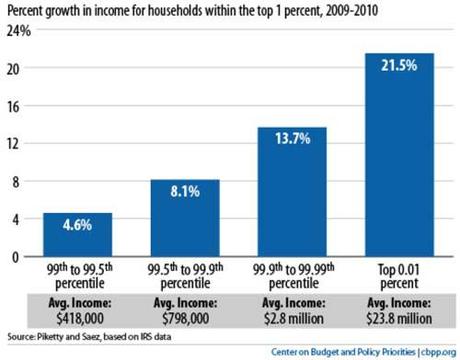
I'm stil jealous of course (good Capitalists are always jealous), as the top .01% (14,000 of us) – who earn an average of $23.8M, were able to add another $4.2M to their annual incomes in 2010. That's 52,500 TIMES the average $80 increase earned by the bottom 99% (thank goodness we're not one of THEM!). That's right, somehow, the riff-raff in the bottom 99% managed to grab 7% of the Nation's total increase in income – clearly Congress needs to make immediate changes to prevent this travesty from happening again!
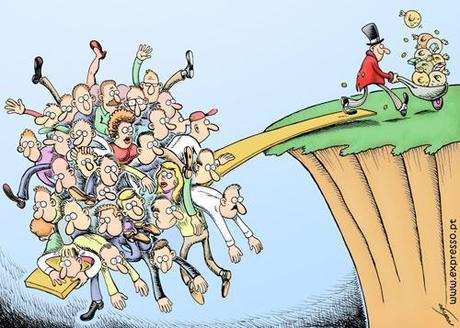
That's Commie talk! If we allow the bottom 99% to make a fair share of the money, they would make 5% more and you know they would only SPEND it on stuff they need TO LIVE. Then our companies would have to provide more goods and services to the bottom 99% and jobs would be created and we, at the top, would have to WAIT for the money to trickle UP from the bottom as only companies that do a good job servicing the bottom 99% would increase in value. Even worse, we may have to WORK (a four-letter word) to provide goods and services for the people who have money in order to EARN (another four-letter word) our Incomes. That's no fun for us at all!
We like it when we get ALL the money and we create just the jobs we choose by buying really expensive cars or really expensive homes or really expensive ($8.50) burritos at CMG because you know an $8.50 burrito creates more jobs than four $2 burritos that poor people would buy at Taco Bell – it's a Rich Person's FACT! My $1M, 6,000 square-foot home created 2 more jobs than the standard $250,000 2,000 square foot home and sure, you could argue that 4 could have been built instead of one for the same price and that 16 people could have been housed instead of 4 and – oops, what was my point going to be???
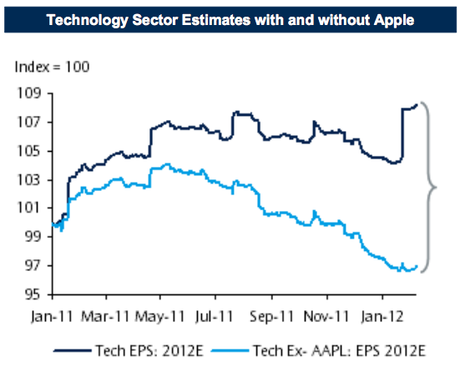
AAPL employs 60,400 people while the rest of the sector empolys (employed) millions but, to be fair to AAPL, they probably employ millions of Chinese people so it's all good somewhere on the planet, right?
The fact that the bottom 99% of the Nasdaq 100 is actually going DOWN in earnings per share doesn't stop investors from taking the AAPLdaq to fresh highs for the century but we're bearish on the Nasdaq because we feel that IF AAPL falters, the crash is going to be SPECTACULAR. Even if AAPL does well, what happens when the sheeple who sampeded into tech get the Q1 earnings reports and discover that AAPL is one of the only positive stories out there?
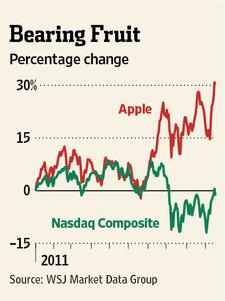
The problem has become so acute that several major firms' analysts are delivering clients two sets of market reports, one with Apple included and one "ex-Apple." The chief equity strategist at UBS AG (NYSE: UBS) creates two versions of his S&P 500 outlook reports; so do analysts at Goldman Sachs Group Inc. (NYSE: GS), Barclay's Capital, Wells Fargo & Co. (NYSE: WFC) and Morgan Stanley (NYSE: MS). For example, they point out to clients that the S&P's fourth quarter 6.6% rise would have been only a 2.8% gain ex-Apple (reflecting Apple's 40% gain since Thanksgiving) and profit margin growth, which registered a 0.05% gain in the fourth quarter, would have actually been a negative 2.2% ex-Apple.
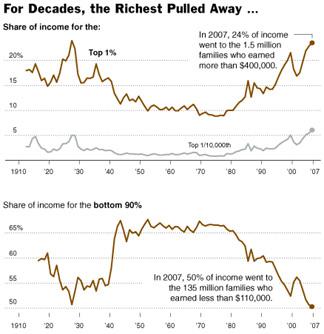
Of course things seem just fine to you if you are in the top 1% and they can only get "better" if you make more money and that means – very simply – less for the bottom 99%. When do we have the ideal amount? When we have 100% and the bottom 99% have zero? We already have 25% and in 2010 we captured 56% of the income gains so our diproportionate share is, indeed, growing even more disproportionate every year. Don't you think we should have a stated goal for how little we want the bottom 99% to have? We've already put them below the 50% line that held in the great depression.
Just like in 1927, the stock market is roaring as the rich get richer and trickle their increased earnings into stocks and commodities, with commodities being the most fun as rich people get to buy things they don't need like bars of gold or tankers full of oil and they SPECULATE that the prices will go up. Of course, when people who don't need a commodity take large quantities of the commodity out of circulation with no intent to consume it – they create an artificial shortage that drives the price of that commodity higher – it's BRILLIANT!
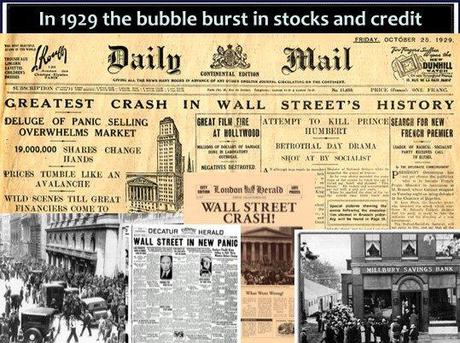
Of course it all ends very badly but BOY – what a ride! No one wants to miss out on the rally, regardless of the consequences and the top 1% have LOTS of money to throw into the markets and, when your income jumps 20% a year - you do tend to want to toss a little more cash into the market and that's how "hot" money flows in.
I had made a similar observation in Friday's post, saying anything other than a move up into Friday's end of quarter would make us very bearish. As I mentioned in Friday's post, we had added some bullish plays in expectations of this but yesterday's move up was so sharp that we took the opportunity to press a few bear side bets – just in case we don't get another crack at yesterday's highs. If we do head higher into the week's end, we still plan to short some more – and if the markets do hold up into April, we'll be happy to capitulate and add more bullish trades but, for now – I'm just not seeing the internals to support these levels.
On Thursday, for example, I mentioned our aggressive DDM trade from Wednesday's Member Chat. DDM was $69.66 on Thursday morning and shot up 1.7% to $70.85 on yesterday's move and that's not bad for a few days "work" but the leveraged trade ideas was buying the DDM May $70/75 bull call spread at $2.10 and selling MCD, XOM or OIH puts to offset (or a combo of the 3). The spread is up .20 and the XOM and MCD puts are up .20 while OIH is flat so .20 to .40 gained in a week on a net $0-.35 credit is very nice for a week in which the Dow has only gained 50 points since Wednesday morning.
So we, in the top 1%, don't fear inflation – nor do we fear a devaluation of our currency because we get to borrow that currency cheaply and leverage it up into massive gains against relatively small moves in the market and, best of all – we get to pay you bottom 99% people the same wages we paid you last year, perhaps even with less benefits, using that rapidly devaluing currency in exhange for your increasingly productive labor. No wonder Corporate Profits are at record highs (even if it is just the top 1% of Corporations)…
God bless Capitalism – and praise be unto Him that we're not at the bottom (99%) of it!

