65M was the total volume for SPY for the day and, as you can see from the volume bars, almost all of that came early in the morning, followed by a dead afternoon in which we drifted higher on NO volume at all. Nothing has changed, it's the same manipulated BS we had at the beginning of the month – only now at much lower volumes.
How can we change our minds about stocks when the data we're looking at is statistically insignificant? What is statistically significant is the Chicago Fed's National Activity Index – one of the most reliable indicators of GDP – and it's pointing down yet again. The CFNAI is a composite of 85 monthly indicators measuring all sorts of things like Manufacturing, Sales, Inventories, Prices, Shipping, etc. and, this month (March) 34 of them were negative. Sure that means 51 were positive but the net was 0 and AGAIN, I ask you, is that the kind of data that we should be paying all-time high prices for stocks against?
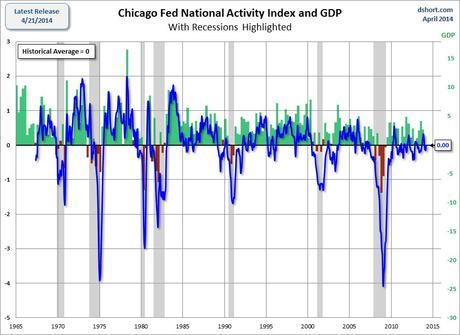
I'm not saying the economy sucks. In fact, it's fantastic for the top 10%. I'm just saying that it's NOT the kind of broad-based recovery that makes me want to place long-term bets at 20+ multiples of earning because, as we discovered in 2008, those earnings projection can quickly turn out to be nothing but BS and the very last people to see it coming are the CEOs and CFOs who make those projections.
As earnings reports are coming in, we're getting mixed signals. 85 of the S&P 500 have reported so far and 67% (57) have beaten on the revenue side, which sounds nice but it's below the 73% average and usually 58% beat on revenues (not that great, actually) but, so far, just 51% are over the line. Half, that's half. That means half the companies reporting are FAILING to make earnings – even with lowered expectations (the weather, late Easter, Bitcoin, Ukraine, Flight 370 – pick an excuse).
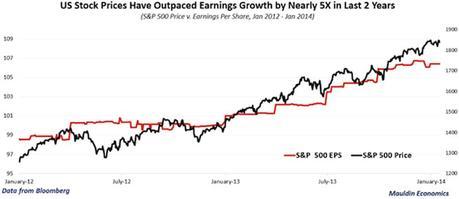
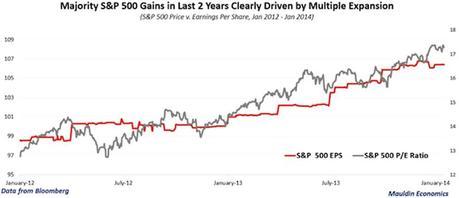
Worse than the light amount of beats is the strength of the beats – just 2% on the earnings side, barely 1/3 of the usual 5.8% average! Revenues are in fact 0.3% BELOW average expectations. Overall, if this trend continues, S&P 500 companies could have the first decline since Q3 of 2012, which led to a 10% sell-off in the S&P. As long as earnings keep going, you can fool some of the people all of the time but you can't fool all of the people all of the time if you're not even showing earnings growth – at a certain point, you have to at least pretend to justify your p/e ratios!
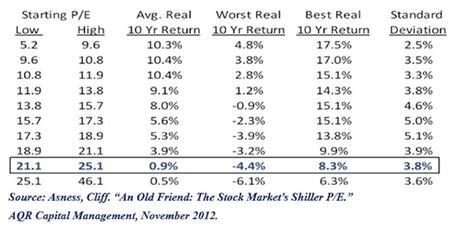
The above chart is from an excellent research paper from 2012, which correctly extrapolated the trend to our current p/e levels (Shiller measure is a bit higher than basic) and we're now 20% higher than when this chart was published. Taking emotions and opinions out of the equation, the bottom line is – we're really pushing our luck here and we all know what the outlying variable is here – THE FED! They are meddling in the economy and causing these discrepencies that make traditional economic models fall apart. Is that a good thing or will it doom us all? Who knows?
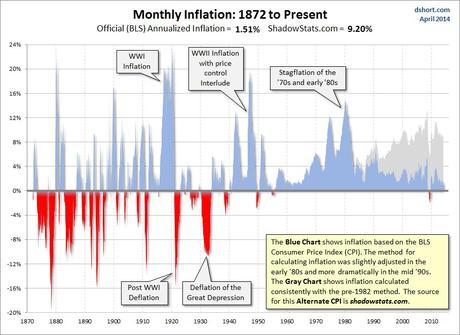
As you can see from Doug Short's chart on the left, we already have some pretty stunning inflation – only we don't calculate inflation that way anymore. The gray area on the chart shows the way the Government calculated inflation before 1982 to keep it consistent and, if you are in the bottom 99%, I'll bet you KNOW which picture is more accurate in real life as well!
So all the BULLSHIT you hear from the Fed about having to keep money flowing to prevent DEflation is complete and utter crap. The Fed is trying to maintain 8-10% INFLATION in order to grow our GDP large enough to have even a remote chance of paying back our MASSIVE $17Tn debt. The debt is fixed for 10 and 30 years at about 3%, so if we grow our $16Tn GDP by 5% per year for 10 years, we get to $26Tn and suddenly we have dropped our debt to GDP ratio from 106% to a more manageable 65%.
That's the plan. Of course the plan falls apart if we borrow even more money during those 10 years. In fact, that's what went wrong pretty much every time we tried to grow our way out of trouble, wasn't it?
IN PROGRESS

