Evening all,
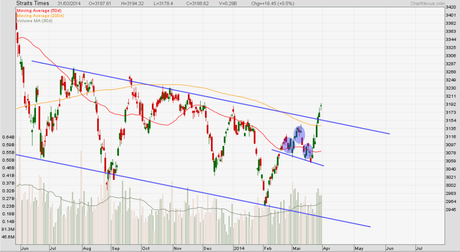
While international markets were looking for clear direction, the STI picked up some points. The STI is above the 200-day MA for the first time in around six months; an easy to spot downward parallel channel is violated on the upside too. A check on the components of the STI reveals “the Jardines” and a few others were drivers of the recent uptick. Outside of the blue chip category, the property counters are enjoying a good run. Quite a few stocks that I blacklisted into my bearish list have been showing signs of life in the last two weeks or so of trading. Naturally, I am disturbed, and am worried for those that I have a position in; but, these are only short-term swings, and only time will tell if they grow into clear mid-term trends.
In the chart below, I highlight a small head and shoulders pattern that formed somewhere near the top of the parallel channel. At that time, it seemed like the head and shoulders appeared at an opportune time: resistance from the upper limit of a channel (I do not use channels for trading but I still lay them on a chart for illustration), and rounding off just below the 200-day MA – ready to send the market below 3,000, perhaps. Far from that result, the STI flew up.
While I am still comfortably a bear, I shall see how the recent strong showing pans out.

All analyses, recommendations, discussions and other information herein are published for general information. Readers should not rely solely on the information published on this blog and should seek independent financial advice prior to making any investment decision. The publisher accepts no liability for any loss whatsoever arising from any use of the information published herein.
