Afternoon traders,
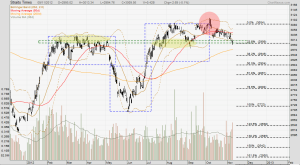
I have a chart of the STI for today. In my last post, I identified a breakout towards the upside form an inverted head and shoulders. (I circle that event in red in the chart below). Days after, the STI gapped down and started trading sideways between the lower band and middle band of the Bollinger Bands. As of now, I have no choice but to see the breakout as a failed one. The STI poked its head above post- US debt downgrade highs but lack of conviction negated the uptick. A short, sharp sell-off following elections in the US dragged the STI down a little. Friday’s low even dipped below 3000. The 3000 region is obviously a very important level for mid-term/long-term analysis. In the short-run ahead, bollinger bands are starting to open up after congestion – which indicates a strong likelihood of a trend emerging. I see the STI as holding onto strong support – but only just. Further downside in global markets will send the STI into 2900 territory.
I do not see any clear trading set-ups for the STI, but the generally bearish mood should warn me to relook charts of blue chip stocks I am trading.

All analyses, recommendations, discussions and other information herein are published for general information. Readers should not rely solely on the information published on this blog and should seek independent financial advice prior to making any investment decision. The publisher accepts no liability for any loss whatsoever arising from any use of the information published herein.
