In almost any sporting event, more points win. In supply chain, less cost wins. But just as the scoreboard reflects a game’s winner, and the total logistics cost disclosed in the annual report might identify supply chain winners, neither tells the entire story. Total logistics cost is only part of the picture for today’s ever changing, dynamic supply chains. Using supply chain scorecards, more granular metrics or key performance indicators (KPIs) can be tracked to gain insight from past performance, permit enhanced overall management and to proactively drive continuous improvements.
TRANSPORTATION SCORECARD
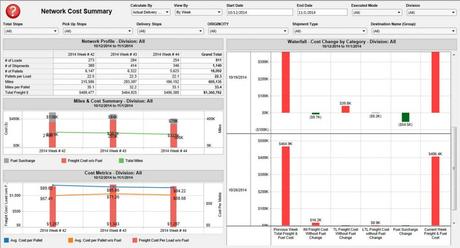
With the average company spending 4.6% of sales on transportation costs (Gartner, 2014), it is important to have a set of scorecards that closely monitors not just the annual freight spend but the overall health of the transportation network. The right scorecard is going to help identify ‘leakage’ defined as cost increasing or service degrading. An example of a Network Overview Scorecard is shown below. Other tactical metrics tracked include prime carrier tender acceptance, lane variance, spot market, freight brokerage and expedited activity. These scorecards all provide insight and an assessment of the operational execution for a transportation network.

Transportation management and the scorecards used to report on this function are not limited to tactical execution. Stepping back from the day- to- day to evaluate the transportation network for improvements from a strategic standpoint is another opportunity to improve performance. Be aware strategic improvements require a change management component in many cases. These improvement initiatives often involve working with other groups and functions within the business, as well as internal and external stakeholders. A few sample strategic metrics include weight or cube utilization, mileage and out-of-region shipping, mode utilization (modal shifts), accessorial costs and benchmarking.
Good transportation scorecards reveal past performance variance to the baseline or plan, and identify root causes of the variances so corrective actions can be taken to get back on track.
WAREHOUSE SCORECARD
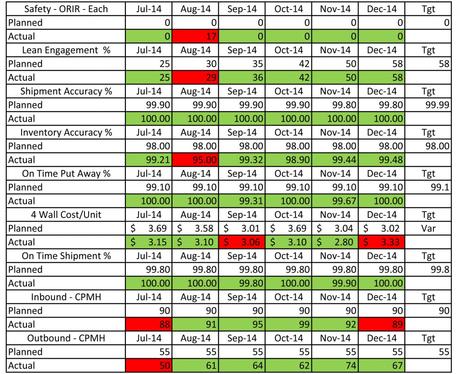
Warehousing and distribution costs the average company 2.3% of sales (Gartner, 2014), which means detailed metrics for this function can help ensure the year is finished under budget. An example of a DC Operations Scorecard is shown below. These scorecards include some version the five most common metrics for warehouse operations: Safety, Quality/Accuracy, Service Level, Productivity and Cost.

Any hourly DC associate knows there are ‘easy’ orders to pick and ‘hard’ orders to pick based on a number of factors. Managers responsible for these operations need good scorecards to help track how this “easy” and “hard” work is morphing and potentially impacting the operation in a positive or negative way.
The list of metrics that help track these factors driving work effort in the warehouse are:
- Mix – Pallet Pick, Carton Pick , Each Pick, and Average Cartons/Inbound Container.
- Profile – Units/Order, Units/line, Lines/Order and Cube/Unit.
- Productivity – Cartons/Man Hour, Shipped Units/Man Hour, Standard hours and Non-Standard hours.
- Flow – Inbound and Outbound Volumes by month, week, and day.
Any discussion of DC Scorecards must also focus on important metrics that can make or break a budget. These include wage rates, straight-time hours, OT hours and training hours for both full-time and temporary labor, direct hours and indirect hours.
These types of warehouse scorecards serve as good gauges of performance to plan and improve the chances of coming in under budget.
VENDOR SCORECARD
Supply chain professionals can have transportation and distribution operations executing like this year’s Super Bowl champs. Throw in a bunch of vendors who are not playing by the rules (vendor compliance guidelines) and a vendor scorecard can reveal a retailer’s costs growing, service levels plummeting and consumption of capital and resources increasing.
The vendor’s product (internal manufacturing, contract manufacturing or use of outside suppliers) is what is moving through transportation and distribution networks. When vendors do not execute to the prescribed guidelines, retailers incur “avoidable costs” that negatively impact the business. A comprehensive vendor scorecard will track the vendors’ performance as well as communicate supply chain exception event info to the vendor so corrective action can be taken.
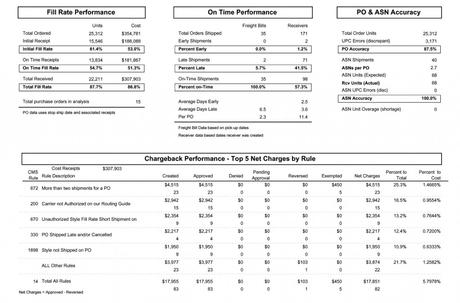
The vendor scorecard tracks detailed metrics in the following categories: Early/Late Shipments, ASN Accuracy, ASN Late/Missing, Freight and Routing , PO Fill Rate, Product Ticketing, Carton Labeling, Floor Readiness and Chargebacks (type, quantity and $). An example of a vendor scorecard is shown below.

Those not using a scorecard to track vendor performance need only ask themselves whether they want their vendors to correct compliance issues. If improved vendor performance is the goal, the vendor scorecard is the best way to consistently communicate expectations, share performance results and drive improved compliance. While vendor scorecards and compliance where made popular by retailers, they are finding use among many companies that rely on internal or outside suppliers for finished goods.
Whether the Super Bowl or almost any sporting event, a champion can be decided by a single play called at the end of the game. Using supply chain scorecards, any supply chain manager can have what’s needed to call the winning play.
Written by Damian Burke
Damian Burke is a Director of Business Development for Ryder. He’s a 26-year veteran in the retail logistics and supply chain industry with deep knowledge in supply chain consulting, third party logistics and material handling integration.

