The Chaos Seminar lunch group at the University of Wisconsin, organized by physicist Clint Sprott and poet Robin Chapman, has been doing a discussion of power laws. The unequal distribution of monetary wealth within a population, the subject of last Thursday's post, provides an example. Here I pass on some of the background material circulated for the seminar. In particular I encourage you to do Sprott's short tutorial on why monetary wealth tends to follow a power law relationship (sometimes referred to as a Pareto distribution or the "80/20" law):
A non-mathematical discussion of power laws (no equations).
For more mathematics, Wikipedia is pretty good.
A contrary view is provided by Charles Franklin.
Sprott's web tutorial showing why monetary wealth tends to follow a power law:
From the tutorial:
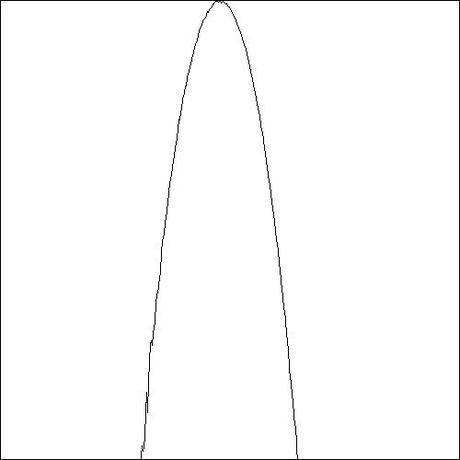
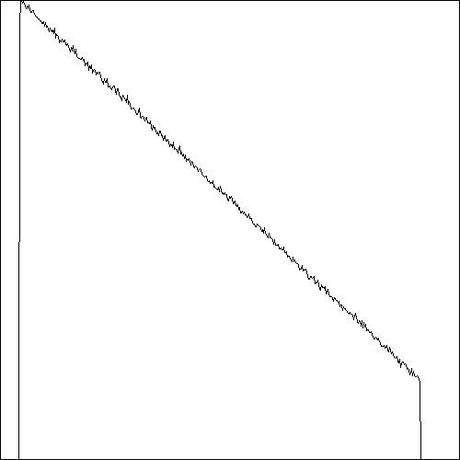
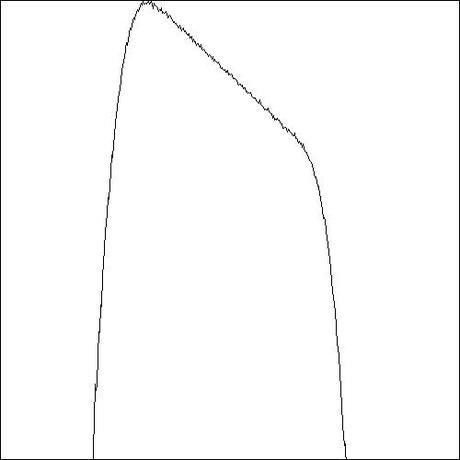
In the simulations, we take a model society with one million individuals and give them all $100,000 which they are free to invest or spend in such a way that their wealth changes by an amount in the range of -10% to +10% each year. We then look at the distribution of wealth within the society after twenty years. The code was written in PowerBASIC and is available for download. (horizontal x-axis is log of wealth - from 10,0000 to 1,000,000 dollars) vertical y-axis is log of probability).
In the first simulation, the rate is chosen uniform random over the allowed range with no memory of the past. Thus each individual executes a random walk, some years gaining money and other years losing it. The distribution of wealth after twenty years is shown on a double logarithmic scale of two decades in the graph at the right. The result is approximately Gaussian as expected.

In the second simulation, the rate is chosen uniform random over the allowed range but with the same rate for each person throughout the twenty year period. As one would expect, the rich get richer and the poor get poorer so that after twenty years the distribution of wealth is as shown in the graph at the right. The result is quite accurately a power law with a slope close to -1.

In the third simulation, the rate each year is half determined by the past and half chosen randomly, with a result as shown in the graph at the right. Interestingly, over a good portion of the range, the distribution of wealth is still quite accurately a power law with the same slope close to -1.


