Reminder: Sabrient is available to chat with Members, comments are found below each post.
Courtesy of Scott Martindale, Senior Managing Director, Sabrient

The dollar weakened further today for the third day in a row with the Greek austerity vote giving some support to the Euro, which gave stocks the green light to move up for a third straight day. As I’ve discussed often in this column, stocks have depended upon a weak dollar, particularly those in the Energy and Basic Materials sectors, which were leaders again today. The market is up about 3% so far this week. But the big mover today was Financials, up 2.3%.
I have been saying that the bulls need leadership from Technology and Financial if they are to maintain some traction, and consumer stocks, as well. Well, Monday was a big day for Tech and today it was Financial. Perhaps counter-intuitively, the onerous settlement announcement from Bank of America (BAC) may have been a catalyst. Yesterday, Energy was the leader, and consumer retailers got a boost from Nike’s (NKE) blow-out earnings report and 10% gain on the day. (Note: Sabrient’s quantitative ratings algorithm moved NKE from a Hold to a Buy last week.) Last week, Tech showed a glimmer of strength, and this week it has provided some follow-through.
The global economy remains strong, with some countries like China actually trying to rein in growth, and most of the companies in the S&P 500 earn much of their profits overseas in the stronger local currencies. However, let’s not forget about the Federal debt ceiling, which must be addressed one way or another by August 2.
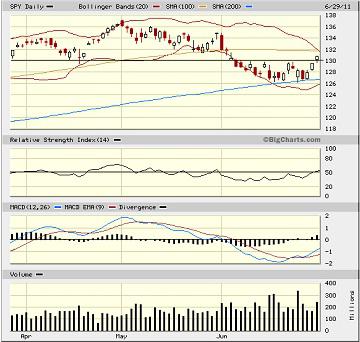
On Monday, the Dow and Russell 2000 recaptured the 12,000 and 800 levels, respectively. However, the S&P 500 was continuing to struggle with very tough resistance at 1300. I suggested that bulls would likely take another run at it, and indeed they finally broke through today.
Let’s look at the SPY chart. In last week’s column, I said that I was seeing several signs of bullish divergences that were quite encouraging. As it turned out, the 200-day moving average provided support for a double bounce, and as I predicted, price is rapidly making its way back up to the upper Bollinger Band. MACD and RSI appear to be holding their bullish crossovers. The 130 level for SPY was the first level of resistance, and price broke through today, although not without an intraday retest of new resistance-turned-support. Increased volume on this important follow-through day versus the prior two bullish days is encouraging. Next resistance is the 132 level, which corresponds with the 100-day simple moving average, May support-turned-resistance, and the upper Bollinger Band.

The TED spread (i.e., indicator of credit risk in the general economy, measuring the difference between the 3-month T-bill and 3-month LIBOR interest rates) closed at 22.54, which is still within its recent 20-25 trading range. The CBOE market volatility index (VIX) fell 10% today alone to close at 17.27, which is the lowest close since May 31. This indicator of fear is back to complacency.
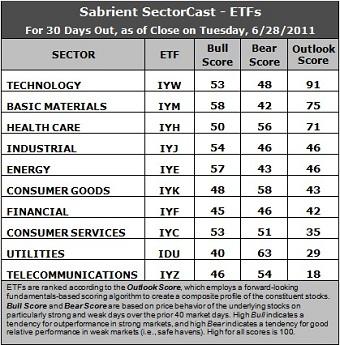
Latest rankings: The table ranks each of the ten U.S. industrial sector iShares (ETFs) by Sabrient’s proprietary Outlook Score, which employs a forward-looking, fundamentals-based, quantitative algorithm to create a bottom-up composite profile of the constituent stocks within the ETF. In addition, the table also shows Sabrient’s proprietary Bull Score and Bear Score for each ETF.
High Bull score indicates that stocks within the ETF have tended recently toward relative outperformance during particularly strong market periods, while a high Bear score indicates that stocks within the ETF have tended to hold up relatively well during particularly weak market periods. Bull and Bear are backward-looking indicators of recent sentiment trend.
As a group, these three scores can be quite helpful for positioning a portfolio for a given set of anticipated market conditions.

Here are some notable observations in Sabrient’s SectorCast scores this week:
1. Technology (IYW) is holding firmly to the top spot with a strong Outlook score of 91. Analysts are still pretty ambivalent and haven’t been coming out lately in support of stocks within any particular sector, but Technology remains net positive in this important metric. IYW remains below its 200-day moving average, but it is closing in on it with some momentum as it is now above its shorter-term 20-day moving average.
2. Basic Materials (IYM) switched back over Healthcare (IYH) and into the top two, scoring a 75. After recapturing its 200-day moving average last Monday, the sector has been a leader in this market bounce, as reflected in its leading Bull score of 58.
3. Industrial (IYJ) held on to the fourth spot in a tie with Energy (IYE), even though its Outlook score dropped below 50 this week. It continues to look strong in long-term growth projections and return on equity.
4. Utilities (IDU) and Telecom (IYZ) remain near the bottom due to poor support among analysts and relatively high projected P/E. However, Consumer Services (IYC) got a nice pop to an Outlook score of 35 – a gain of about 50% from last week’s 23 – as analysts came out with some long-awaited upgrades. Retailers overall got a boost from reports like Nike’s (even though NKE is actually in the IYK, not IYC).
5. The forward-looking Outlook rankings continue to reflect a cautiously bullish bent, in my opinion. The improving score in Consumer Services (IYC) is a big positive this week, but Financial (IYF) and Industrial (IYJ) need to find more analyst support.
6. Looking at the Bull scores, Basic Materials (IYM) and Energy (IYE) are clearly the strongest on strong market days, followed by Industrial (IYJ), Technology (IYW), and Consumer Services (IYC). Utilities (IDU) is the weakest. As I have been saying, Financial (IYF) needs to get some footing and behave better on bullish days if the market is going to get real traction. Perhaps today’s strength will provide a good start.
7. As for the Bear scores, Utilities (IDU) is the clear investor favorite on weak market days. Healthcare (IYH) and Consumer Goods (IYK) also hold up relatively well. Basic Materials (IYM) and Energy (IYE) which have the best Bull scores, have been the clear laggards on weak market days, reflecting quick abandonment among scared investors.
Overall, Technology (IYW) displays the best combination of Outlook/Bull/Bear scores. Adding up the three scores gives it a total score of 192. Defensive sectors Healthcare (IYH) and Consumer Goods (IYK) again share the best combination of Bull/Bear with a total score of 106.
Top ranked stocks in Technology and Basic Materials include F5 Networks (FFIV), Riverbed Technology (RVBD), CF Industries (CF), and Sociedad Quimica y Minera de Chile (SQM).
Low ranked stocks in Utilities and Telecom include Cheniere Energy Partners (CQP), Clean Energy Fuels (CLNE), American Tower (AMT), and SBA Communications (SBAC).
These scores represent the view that the Technology and Basic Materials sectors may be relatively undervalued overall, while Utilities and Telecom sectors may be relatively overvalued, based on our 1-3 month forward look.
Disclosure: Author has no positions in stocks or ETFs mentioned.
About SectorCast: Rankings are based on Sabrient’s SectorCast model, which builds a composite profile of each equity ETF based on bottom-up scoring of the constituent stocks. The Outlook Score employs a fundamentals-based multi-factor approach considering forward valuation, earnings growth prospects, Wall Street analysts’ consensus revisions, accounting practices, and various return ratios. It has tested to be highly predictive for identifying the best (most undervalued) and worst (most overvalued) sectors, with a one-month forward look.
Bull Score and Bear Score are based on the price behavior of the underlying stocks on particularly strong and weak days during the prior 40 market days. They reflect investor sentiment toward the stocks (on a relative basis) as either aggressive plays or safe havens. So, a high Bull score indicates that stocks within the ETF have tended recently toward relative outperformance during particularly strong market periods, while a high Bear score indicates that stocks within the ETF have tended to hold up relatively well during particularly weak market periods.
Thus, ETFs with high Bull scores generally perform better when the market is hot, ETFs with high Bear scores generally perform better when the market is weak, and ETFs with high Outlook scores generally perform well over time in various market conditions.
Of course, each ETF has a unique set of constituent stocks, so the sectors represented will score differently depending upon which set of ETFs is used. For Sector Detector, I use ten iShares ETFs representing the major U.S. business sectors.
About Trading Strategies: There are various ways to trade these rankings. First, you might run a sector rotation strategy in which you buy long the top 2-4 ETFs from SectorCast-ETF, rebalancing either on a fixed schedule (e.g., monthly or quarterly) or when the rankings change significantly. Another alternative is to enhance a position in the SPDR Trust exchange-traded fund (SPY) depending upon your market bias. If you are bullish on the broad market, you can go long the SPY and enhance it with additional long positions in the top-ranked sector ETFs. Conversely, if you are bearish and short (or buy puts on) the SPY, you could also consider shorting the two lowest-ranked sector ETFs to enhance your short bias.
However, if you prefer not to bet on market direction, you could try a market-neutral, long/short trade—that is, go long (or buy call options on) the top-ranked ETFs and short (or buy put options on) the lowest-ranked ETFs. And here’s a more aggressive strategy to consider: You might trade some of the highest and lowest ranked stocks from within those top and bottom-ranked ETFs, such as the ones I identify above.

This entry was posted on Wednesday, June 29th, 2011 at 8:19 pm and is filed under Immediately available to public. You can leave a response, or trackback from your own site.
Do you know someone who would benefit from this information? We can send your friend a strictly confidential, one-time email telling them about this information. Your privacy and your friend's privacy is your business... no spam! Click here and tell a friend!
