Courtesy of Scott Martindale, Senior Managing Director, Sabrient

Utilities and Healthcare are trying to hold up the market this week as Financial, Industrial, Basic Materials, and Technology have led the way down. There appears to be little optimism for the banks, given the worsening housing market and imminent end of QE2 (no more free money). Ciena (CIEN) and SINA (SINA) were big losers in Tech-land today. But it is beaten-down Technology that is rising in Sabrient’s SectorCast rankings.
Oil spiked today by about 2%. U.S. energy expenditures are once again above 9% of GDP, which has not been a good omen in the past. The nuclear disaster in Japan only serves to put more speculative pressure on oil prices as countries now are shying away from nuclear power. And then of course there is the continued economic drag from the resulting recession in such an important economy as Japan.
But it’s not just Japan. Global economic growth remains the big concern, particularly with the disappointing data that has been coming out lately in the U.S. and the credit woes in the EU. FOMC Chairman Bernanke’s speech yesterday was somewhat reassuring, as he and most economists say that the pace of recovery should accelerate in the second half of the year, but his remarks weren’t perceived to be sufficiently optimistic, resulting in the late day selloff. It didn’t help that the World Bank cut its 2011 forecast for global growth.
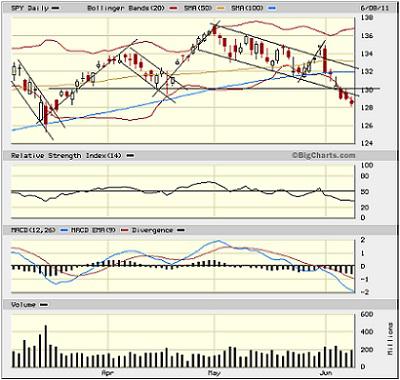
Last Tuesday, after the Memorial Day holiday, I observed that the bulls appeared to be gathering support and confidence to take the market higher, and indeed we saw a nice breakout to close the month of May on a strongly bullish note and back above all daily moving averages. The “Sell in May” crowd had made little progress. But then Wednesday arrived with bad economic news, and it all fell apart. It’s been downhill ever since.
The chart shows three successive bull flag patterns, each one hitting a progressively higher high. The textbook breakout on May 31 looked quite promising, but the next day brought a big ugly red candle rather than a continued building of the “flagpole.” And since then, June has been dismal, with this week bringing a complete breakdown of support levels. The 200-day moving average is all the way down near 126, and that could be a target level of support. How quickly a nicely developing chart pattern can turn around and scare away the bulls.

Nevertheless, I see some hope in the chart. For one, volume on the big June 1 red candle was half of what it was on the March 16 selloff. RSI and MACD are severely oversold, which should lead to a more robust attempt to bounce. Also, Technology, as represented by IYW, is now at its 200-day moving average and deeply oversold, so it could be a leader in any reversal attempt. But Financials are going to need to firm up if it’s to be more than just a brief bounce.
The TED spread (i.e., indicator of credit risk in the general economy, measuring the difference between the 3-month T-bill and 3-month LIBOR interest rates) closed at 22.48, which is still relatively low in its range. Fear as measured by the CBOE market volatility index (VIX) closed at 18.79, which is up only slightly from last week, despite the continued selling in the market. Neither indicator is reflecting a great deal of fear.
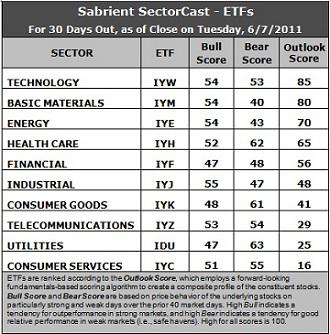
Latest rankings: The table ranks each of the ten U.S. industrial sector iShares (ETFs) by Sabrient’s proprietary Outlook Score, which employs a forward-looking, fundamentals-based, quantitative algorithm to create a bottom-up composite profile of the constituent stocks within the ETF. In addition, the table also shows Sabrient’s proprietary Bull Score and Bear Score for each ETF.
High Bull score indicates that stocks within the ETF have tended recently toward relative outperformance during particularly strong market periods, while a high Bear score indicates that stocks within the ETF have tended to hold up relatively well during particularly weak market periods. Bull and Bear are backward-looking indicators of recent sentiment trend.
As a group, these three scores can be quite helpful for positioning a portfolio for a given set of anticipated market conditions.
Here are some notable observations in this week’s Sabrient’s SectorCast Outlook scores.

1. Basic Materials (IYM) dropped 17 points in its Outlook score, while Technology (IYW) rose 20 points. Analysts have gone silent on supporting stocks lately, so the dearth of information caused some shuffling in the relative scores among sectors. Although it might not persist, for the moment, IYW has the best Outlook score of 85, while IYM comes in second with 80.
2. Healthcare (IYH) lost 10 points, as analysts have backed off somewhat this week and the sector’s strong relative price performance has slightly knocked back its projected P/E.
3. Financial (IYF) slid further in the rankings while Energy got a 14-point boost to move from fifth up to third.
4. The 3-tier ranking, in which IYM led by a large margin, and IDU, IYC, and IYZ were mired at the bottom, has dissipated into a more smoothly distributed ranking. Nevertheless, the bottom three continue to be weighed down by poor support among analysts, high projected P/E, and in the case of IYC, poor return on sales as retail margins remain low.
5. The Outlook rankings continue to reflect a cautiously bullish bent, which is counter to what we hear in the news each day. The low score in Consumer Services (IYC) is still worrisome, but otherwise, the rise in IYW and ongoing strength in IWM and IYE (and even IYF) is moderately bullish.
Looking at the Bull scores, Industrial (IYJ), Energy (IYE), Technology (IYW), and Basic Materials (IYM), tend to lead on the strong market days. Financial (IYF) continues to be the biggest laggard on strong market days, reflecting ongoing uncertainty in that sector, and that has been disappointing.
As for the Bear scores, Utilities (IDU), Healthcare (IYH), and Consumer Goods (IYK) are the favorite “safe haven” sectors. Telecom (IYZ) has fallen back a bit. Energy (IYE) and Basic Materials (IYM), which sport some of the best Bull scores, have been the clear laggards on weak market days, reflecting quick abandonment among investors.
Overall, Technology (IYW) now displays the best combination of Outlook/Bull/Bear scores. Adding up the three scores gives it a total score of 192. Healthcare (IYH) enjoys the best combination of Bull/Bear with a total score of 114.
Top ranked stocks in Technology and Basic Materials include Ebix Inc. (EBIX), Apple Inc. (AAPL), CF Industries (CF), Cliffs Natural Resources (CLF).
Low ranked stocks in Utilities and Consumer Services include DigitalGlobe (DGI), Clean Energy Fuels (CLNE), IHS Inc. (IHS), and amazon.com (AMZN). These scores represent the view that the Technology and Basic Materials sectors may be relatively undervalued overall, while Utilities and Consumer Services sectors may be relatively overvalued, based on our 1-3 month forward look.
Disclosure: Author has no positions in stocks or ETFs mentioned.
About SectorCast: Rankings are based on Sabrient’s SectorCast model, which builds a composite profile of each equity ETF based on bottom-up scoring of the constituent stocks. The Outlook Score employs a fundamentals-based multi-factor approach considering forward valuation, earnings growth prospects, Wall Street analysts’ consensus revisions, accounting practices, and various return ratios. It has tested to be highly predictive for identifying the best (most undervalued) and worst (most overvalued) sectors, with a one-month forward look.
Bull Score and Bear Score are based on the price behavior of the underlying stocks on particularly strong and weak days during the prior 40 market days. They reflect investor sentiment toward the stocks (on a relative basis) as either aggressive plays or safe havens. So, a high Bull score indicates that stocks within the ETF have tended recently toward relative outperformance during particularly strong market periods, while a high Bear score indicates that stocks within the ETF have tended to hold up relatively well during particularly weak market periods.
Thus, ETFs with high Bull scores generally perform better when the market is hot, ETFs with high Bear scores generally perform better when the market is weak, and ETFs with high Outlook scores generally perform well over time in various market conditions.
Of course, each ETF has a unique set of constituent stocks, so the sectors represented will score differently depending upon which set of ETFs is used. For Sector Detector, I use ten iShares ETFs representing the major U.S. business sectors.
About Trading Strategies: There are various ways to trade these rankings. First, you might run a sector rotation strategy in which you buy long the top 2-4 ETFs from SectorCast-ETF, rebalancing either on a fixed schedule (e.g., monthly or quarterly) or when the rankings change significantly. Another alternative is to enhance a position in the SPDR Trust exchange-traded fund (SPY) depending upon your market bias. If you are bullish on the broad market, you can go long the SPY and enhance it with additional long positions in the top-ranked sector ETFs. Conversely, if you are bearish and short (or buy puts on) the SPY, you could also consider shorting the two lowest-ranked sector ETFs to enhance your short bias.
However, if you prefer not to bet on market direction, you could try a market-neutral, long/short trade—that is, go long (or buy call options on) the top-ranked ETFs and short (or buy put options on) the lowest-ranked ETFs. And here’s a more aggressive strategy to consider: You might trade some of the highest and lowest ranked stocks from within those top and bottom-ranked ETFs, such as the ones I identify above.


