 I don’t know about you, but I’m getting a lot of auto-response emails from folks in the investment world who are on vacation these days. Yes, the summer doldrums have set in, often leaving junior portfolio managers—without seniority, vacation time, school-age children, or much in the way of discretionary authority—to mind the store. And yet, the specter of global uncertainty remains at the front of every portfolio manager’s mind…even as they bask in the sun in Maui or The Hamptons.
In case you’ve lost track, the shroud of uncertainty comprises major issues like U.S. tax reform, the Supreme Court ruling on Obamacare, the U.S. debt ceiling, the so-called “fiscal cliff” at the end of 2012, the imminent U.S. presidential election, and of course, slowing growth in China and Europe’s never-ending debt crisis. Nothing trivial in this list.
Trading volume was notably lower on Wednesday, and of course next week has the 4th of July holiday smack-dab in the middle of the week, which virtually guarantees that the whole week will be slow and sleepy. Some say the small stock market bounce on Tuesday-Wednesday was due to the promising U.S. economic data, while other chalked it up to short-covering ahead of yet another European Union summit.
The hope among global investors is for a sign of commitment from EU leaders to stimulate growth, create a banking union, debt mutualization (e.g., Eurobonds), and make progress toward a cohesive political structure across the region.
Although Spain’s 10-year bond yield fell hard to below 6.4% last week, this week it has bounced back up to near 7%. But in the U.S., the Fed’s Operation Twist, which was to expire this month, was instead extended, as you know. This program swaps short-term bonds for longer durations, reducing interest rates on mortgages and business loans, i.e., provide cheap credit.
Although not all borrowers have gained access to this cheap credit, some of the diversified REITs have taken advantage of the low borrowing rates to boost their profits and pay high dividends, which has attracted investors, particularly since the U.S. housing market continues to show signs of recovery. Two such REITs that are ultra-high-yielding are Annaly Capital Management (NLY) and Invesco Mortgage Capital (IVR).
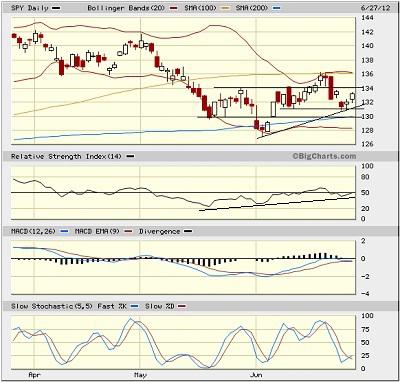
Let’s look at the charts. SPY closed Wednesday at 133.17. Now it finds itself back in the middle of its Bollinger Bands, back inside the previous channel between 131 and 134, and in the middle of what appears to be a potential bullish ascending triangle pattern. The lower line of the sideways channel corresponds with the 200-day SMA, so it is a critical support level. However, it also has fallen back below its 50-day simple moving average (SMA). Overall, there’s nothing particularly concerning here.

The VIX (CBOE Market Volatility Index—a.k.a. “fear gauge”) closed Wednesday at 19.45. After falling back below 18 last Wednesday, Thursday’s selloff put it back up again resistance at the important 20 level, where it remains. Obviously, further market weakness will push VIX above 20. Given so many potentially negative catalysts around the world, it seems that VIX “should be” trading above 20.
In fact, ConvergEx reports that while implied volatilities (and the VIX) are inordinately low, industry correlations relative to the overall S&P500 index are at a highly-correlated 88%, which they say is an indication of an unhealthy market.
As a reminder, be sure to check out the latest edition of The MacroReport, which focuses on Global Oil. A co-publication of Sabrient Systems and MacroRisk Analytics, The MacroReport provides in-depth analysis of the macroeconomic trends in focus regions and how they might impact the U.S., with specific actionable ideas.
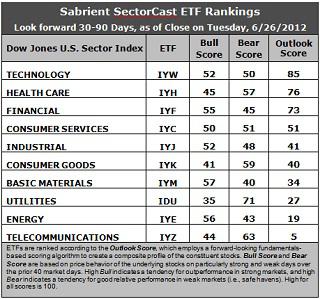
Latest rankings: The table ranks each of the ten U.S. industrial sector iShares (ETFs) by Sabrient’s proprietary Outlook Score, which employs a forward-looking, fundamentals-based, quantitative algorithm to create a bottom-up composite profile of the constituent stocks within the ETF. In addition, the table also shows Sabrient’s proprietary Bull Score and Bear Score for each ETF.
High Bull score indicates that stocks within the ETF have tended recently toward relative outperformance during particularly strong market periods, while a high Bear score indicates that stocks within the ETF have tended to hold up relatively well during particularly weak market periods. Bull and Bear are backward-looking indicators of recent sentiment trend.
As a group, these three scores can be quite helpful for positioning a portfolio for a given set of anticipated market conditions.

Observations:
1. Technology (IYW) retains the top spot with an Outlook score of 85 this week, followed once again by Healthcare (IYH) at 76. Financial (IYF) remains third at 73. The top three further increased their distance above the rest of the pack, with a 22-point gap down to fourth place Consumer Services (IYC), as Industrial (IYJ) drops 10 points. Still, these rankings are reflective of an overall bullish bias, with the economically sensitive sectors like Technology, Financial, Consumer Services, and Industrial in the top five. Basic Materials (IYM) has fallen below Consumer Goods (IYK), which is not bullish.
2. Utilities (IDU) moves out of the bottom two this week, as Energy (IYE) falls into the cellar to join Telecom (IYZ). IYZ is saddled with the highest (worst) forward P/E and the worst return ratios. Although IYE and IYM are among the best in forward P/E, they continue to be abandoned by Wall Street.
3. Looking at the Bull scores, Basic Materials (IYM) and Energy (IYE) are the leaders on strong market days, scoring 57 and 56, respectively. Utilities (IDU) is still by far the weakest on strong days, scoring 35. In other words, Materials and Energy stocks have tended to perform the best when the market is rallying, while Utilities stocks have lagged.
4. Looking at the Bear scores, Utilities (IDU) remains the investor favorite “safe haven” on weak market days, scoring an impressive 71, outdistancing Telecom (IYZ) at 63. Although Materials (IYM) and Energy (IYE) are the investor favorites on strong market days, they have been abandoned (relatively speaking) by investors during market weakness, as reflected by their low Bear scores of 40 and 43. In other words, Materials and Energy stocks have tended to sell off the most when the market is pulling back, while Utilities stocks have held up the best—just the opposite of the Bull scores.
5. Overall, IYW shows the best all-weather combination of Outlook/Bull/Bear scores. Adding up the three scores gives a total of 187. IYZ is the worst at 112. IDU and IYZ reflect by far the best combination of Bull/Bear at 107 and 106 (driven by their robust Bear scores). Materials (IYM) displays the worst combination of Bull/Bear with an anemic 97.
These scores represent the view that the Technology and Healthcare sectors may be relatively undervalued overall, while Telecom and Energy sectors may be relatively overvalued, based on our 1-3 month forward look.
Top-ranked stocks within Technology and Healthcare sectors include Oracle (ORCL), Seagate Technology (STX), Community Health Systems (CYH), and Gilead Sciences (GILD).
Disclosure: Author has no positions in stocks or ETFs mentioned.
About SectorCast: Rankings are based on Sabrient’s SectorCast model, which builds a composite profile of each equity ETF based on bottom-up scoring of the constituent stocks. The Outlook Score employs a fundamentals-based multi-factor approach considering forward valuation, earnings growth prospects, Wall Street analysts’ consensus revisions, accounting practices, and various return ratios. It has tested to be highly predictive for identifying the best (most undervalued) and worst (most overvalued) sectors, with a one-month forward look.
Bull Score and Bear Score are based on the price behavior of the underlying stocks on particularly strong and weak days during the prior 40 market days. They reflect investor sentiment toward the stocks (on a relative basis) as either aggressive plays or safe havens. So, a high Bull score indicates that stocks within the ETF have tended recently toward relative outperformance during particularly strong market periods, while a high Bear score indicates that stocks within the ETF have tended to hold up relatively well during particularly weak market periods.
Thus, ETFs with high Bull scores generally perform better when the market is hot, ETFs with high Bear scores generally perform better when the market is weak, and ETFs with high Outlook scores generally perform well over time in various market conditions.
Of course, each ETF has a unique set of constituent stocks, so the sectors represented will score differently depending upon which set of ETFs is used. For Sector Detector, I use ten iShares ETFs representing the major U.S. business sectors.
About Trading Strategies: There are various ways to trade these rankings. First, you might run a sector rotation strategy in which you buy long the top 2-4 ETFs from SectorCast-ETF, rebalancing either on a fixed schedule (e.g., monthly or quarterly) or when the rankings change significantly. Another alternative is to enhance a position in the SPDR Trust exchange-traded fund (SPY) depending upon your market bias. If you are bullish on the broad market, you can go long the SPY and enhance it with additional long positions in the top-ranked sector ETFs. Conversely, if you are bearish and short (or buy puts on) the SPY, you could also consider shorting the two lowest-ranked sector ETFs to enhance your short bias.
However, if you prefer not to bet on market direction, you could try a market-neutral, long/short trade—that is, go long (or buy call options on) the top-ranked ETFs and short (or buy put options on) the lowest-ranked ETFs. And here’s a more aggressive strategy to consider: You might trade some of the highest and lowest ranked stocks from within those top and bottom-ranked ETFs, such as the ones I identify above.

