Last week, the spotlight of worry was back on Greece’s solvency. This week it is Spain’s turn again to spook us. Greece, Spain, and Italy are in economic disarray, and the prospect of growing their way out of trouble appears unlikely given the recessionary forces. Even emerging market darlings like Brazil, China, and India are struggling. Although U.S. companies have been hanging in there—buoyed by a supportive Fed—with overall improving earnings reports, overseas markets are rife with uncertainty and the fear of spreading global contagion.
The EU summit resulted in little more than the usual—acknowledgment that something’s gotta change, but no consensus on what to do. The drawbacks to the Eurozone monetary union concept of governing by consensus are being exposed.
Thus, money continues to pour into the safety of U.S. Treasuries. The 10-year yield now sits at a 60-year low. The prospect of European bank recapitalizations gave U.S. stocks an excuse to bounce on Tuesday, but Wednesday gave it all back. The euro set a near two-year low of less than $1.24 this week. Relative strength in the USD serves as a ball-and-chain on U.S. stock prices.
In a nutshell, investors in the U.S. and abroad have become paralyzed into a safety-first mentality. And in the words of Forrest Gump, that’s all I have to say about that.
On Wednesday, Energy stocks got creamed by 3.0%. Financials took a 2.2% hit. Nevertheless, U.S. equities have a lot going for them. This week’s Sabrient SectorCast ETF rankings are only slightly less risk-oriented than last week’s. Stocks from the “riskier” sectors bucking the selling trend on Wednesday included financial SLM Corp (SLM), technology Apple Inc. (AAPL), and materials stock Monsanto (MON).
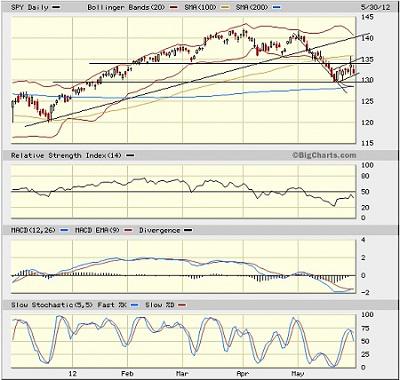
SPY closed Wednesday at 131.76. Volume has been only moderate. Price might be forming a bear flag pattern as shown in the chart. Support at 130, followed by the 200-day moving average just below, are being tested again. After a bounce attempt, RSI, MACD, and Slow Stochastic all appear to be weakening.

The TED spread (indicator of credit risk in the general economy, measuring the difference between the 3-month T-bill and 3-month LIBOR interest rates) closed Wednesday at 40 bps. The VIX (CBOE Market Volatility Index—a.k.a. “fear gauge”) closed Wednesday at 24.14, as it continues to rise while stocks fall. Still, last fall in the heat of the Eurozone crisis, fear was elevated and 30 was strong support, so despite renewed fear and uncertainty around the Eurozone, VIX is still relatively low.
As a reminder, The MacroReport is Sabrient’s newest product providing an in-depth analysis of the macroeconomic trends in around the world and their impact on the U.S. economy, along with actionable ideas (U.S. stocks and ETFs). Complimentary access is still available on Sabrient’s web site through MacroReport InterActive. The current issue focuses on Global Oil, including drivers and impacts.
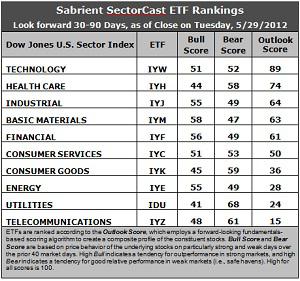
Latest rankings: The table ranks each of the ten U.S. industrial sector iShares (ETFs) by Sabrient’s proprietary Outlook Score, which employs a forward-looking, fundamentals-based, quantitative algorithm to create a bottom-up composite profile of the constituent stocks within the ETF. In addition, the table also shows Sabrient’s proprietary Bull Score and Bear Score for each ETF.
High Bull score indicates that stocks within the ETF have tended recently toward relative outperformance during particularly strong market periods, while a high Bear score indicates that stocks within the ETF have tended to hold up relatively well during particularly weak market periods. Bull and Bear are backward-looking indicators of recent sentiment trend.
As a group, these three scores can be quite helpful for positioning a portfolio for a given set of anticipated market conditions.

Observations:
1. Technology (IYW) takes the top spot with a 89 this week. The biggest moves were in Financial (IYF), which fell 20 points, and in Healthcare (IYH), which jumped 19 points. Stocks within IYF saw Wall Street analysts lowering earnings projections—likely due to concerns about exposure to European banks. Stocks within IYH saw analysts come out with renewed support of the sector. Industrial (IYJ) remains in third, followed by a rising Basic Materials (IYM).
2. Consumer Services (IYC) also made an impressive 21-point jump this week, mainly on its relatively high level of support from Wall Street. This is still a bullish looking ranking, despite the ongoing headline risk and resultant investor reluctance.
3. Utilities (IDU) and Telecom (IYZ) remain in the bottom two. Although both saw some heightened support among Wall Street analysts, IDU is saddled with the lowest long-term growth rate, and IYZ has the highest (worst) forward P/E.
4. Looking at the Bull scores, Basic Materials (IYM) has been quite strong on strong market days, scoring 58, followed by Financial (IYF), Industrial (IYJ), and Energy (IYE). Utilities (IDU) is by far the weakest on strong days, scoring 41.
5. Looking at the Bear scores, Utilities (IDU) remains the investor favorite “safe haven” on weak market days, scoring a strong 68, followed by Telecom (IYZ). Materials (IYM) has the lowest Bear score of 46, followed by IYF, IYE, and IYJ. (Notice that this is the exact opposite of the Bull scores, as these four ETFs sit at the top of the Bull rankings.) Stocks within IYM have tended to sell off the most when the market is pulling back.
6. Overall, IYW now shows the best all-weather combination of Outlook/Bull/Bear scores. Adding up the three scores gives a total of 192. IYZ is the worst at 114. However, IYZ and IDU now reflect the best combination of Bull/Bear at 109, which is both defensive and bearish for the overall market. Healthcare (IYH) displays the worst combination with a 102.
These scores represent the view that the Technology and Healthcare sectors may be relatively undervalued overall, while Telecom and Utilities sectors may be relatively overvalued based on our 1-3 month forward look.
Top-ranked stocks within Technology and Healthcare sectors include Apple (AAPL), NetEase (NTES), Select Medical Holdings (SEM), and United Therapeutics (UTHR).
Disclosure: Author has no positions in stocks or ETFs mentioned.
About SectorCast: Rankings are based on Sabrient’s SectorCast model, which builds a composite profile of each equity ETF based on bottom-up scoring of the constituent stocks. The Outlook Score employs a fundamentals-based multi-factor approach considering forward valuation, earnings growth prospects, Wall Street analysts’ consensus revisions, accounting practices, and various return ratios. It has tested to be highly predictive for identifying the best (most undervalued) and worst (most overvalued) sectors, with a one-month forward look.
Bull Score and Bear Score are based on the price behavior of the underlying stocks on particularly strong and weak days during the prior 40 market days. They reflect investor sentiment toward the stocks (on a relative basis) as either aggressive plays or safe havens. So, a high Bull score indicates that stocks within the ETF have tended recently toward relative outperformance during particularly strong market periods, while a high Bear score indicates that stocks within the ETF have tended to hold up relatively well during particularly weak market periods.
Thus, ETFs with high Bull scores generally perform better when the market is hot, ETFs with high Bear scores generally perform better when the market is weak, and ETFs with high Outlook scores generally perform well over time in various market conditions.
Of course, each ETF has a unique set of constituent stocks, so the sectors represented will score differently depending upon which set of ETFs is used. For Sector Detector, I use ten iShares ETFs representing the major U.S. business sectors.
About Trading Strategies: There are various ways to trade these rankings. First, you might run a sector rotation strategy in which you buy long the top 2-4 ETFs from SectorCast-ETF, rebalancing either on a fixed schedule (e.g., monthly or quarterly) or when the rankings change significantly. Another alternative is to enhance a position in the SPDR Trust exchange-traded fund (SPY) depending upon your market bias. If you are bullish on the broad market, you can go long the SPY and enhance it with additional long positions in the top-ranked sector ETFs. Conversely, if you are bearish and short (or buy puts on) the SPY, you could also consider shorting the two lowest-ranked sector ETFs to enhance your short bias.
However, if you prefer not to bet on market direction, you could try a market-neutral, long/short trade—that is, go long (or buy call options on) the top-ranked ETFs and short (or buy put options on) the lowest-ranked ETFs. And here’s a more aggressive strategy to consider: You might trade some of the highest and lowest ranked stocks from within those top and bottom-ranked ETFs, such as the ones I identify above.

