The Financial sector soared on Wednesday, continuing to lead this impressive market rally. It was by far the strongest sector, up +2.7% for the day. This is all about the news coming out of Europe, which is encouraging at the moment. But we won’t know much more until the G20 summit, which is scheduled to begin on November 3, when French President Sarkozy and German Chancellor Merkel have said they will release the details of their plan to ease the European debt crisis.
Despite recent performance, large cap financials are still down around 20% year to date, as the big institutions have been hit hard. As reflected in Sabrient’s SectorCast ETF rankings, analysts remain cautious for the Financial sector. Nevertheless, the big caps have been at the forefront of the latest rally, which has taken the market back to the top of its 9-week sideways trading channel. Although the market might need to stop for a breather here, valuations remain compelling, assuming global recession can be averted.
Despite widespread negative sentiment, depressed housing, poor U.S. auto demand, a high CBOE put/call ratio, high volatility (VIX), and extreme bearishness among newsletter writers, it appears that third-quarter 2011 GDP will likely show real growth of 2.5%, which is well above the first-half growth rate of less than 1%, and better than recent consensus forecasts. Consumer spending, improved trade deficit, recapitalization of European banks, China’s resurgent PMI, and continued strong U.S. corporate profits are all contributors to an improved outlook. The spread between S&P 500 earnings yield and corporate bond yields is at a multi-decade high, making stocks look like a bargain.
And now earnings season has commenced, so the next couple of weeks will be giving us new insight into the state of the economy and companies’ forward guidance. JP Morgan (JPM) and Google (GOOG) are notable bellwethers reporting this week. Some think that analysts have been overly cautious, so if true, we should see a lot of upside surprises.
I want to mention that Sabrient recently acquired Gradient Analytics, which produces “deep dive” research into forensic accounting, earnings quality, and anomalous executive behavior (in equity incentives). Gradient made a great call early last week on Rockwood Holdings (ROC) after the CEO made a couple of large exercise-and-hold transactions. Since then, ROC is up over 30% in just over a week. Gradient also has been pounding the table about the unusually large insider selling activity, poor earnings quality, and extreme valuation of Green Mountain Coffee Roasters (GMCR). In the two months since Gradient’s research note on August 15, GMCR is down about 20%.
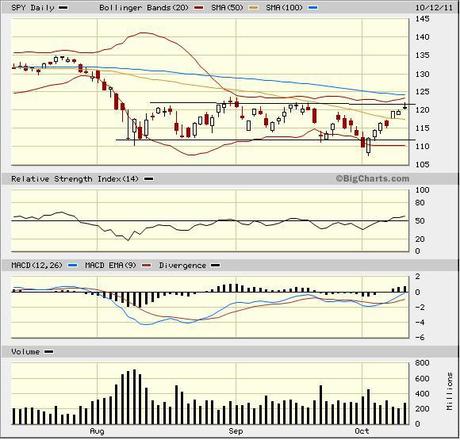
Looking at the SPY chart, the SPY closed at 120.75 on Wednesday, which is back to the top of the channel between support at 112 and resistance at 122. In fact, it eclipsed the 122 mark intraday on Wednesday before falling back late in the day. Price broke through the 50-day moving average like it wasn’t even there. Let’s see if it can ultimately break through resistance at the top of its 9-week trading range.

The VIX (CBOE Market Volatility Index – a.k.a. “fear gauge”) closed Wednesday at 31.26, which is down significantly from the mid-40s where it traded at the first of the month – a definite improvement in investor confidence.
The TED spread (indicator of credit risk in the general economy, measuring the difference between the 3-month T-bill and 3-month LIBOR interest rates) continues to remain elevated, as it closed Wednesday at 39.07. Although not nearly so high as it was during the 2008 financial crisis, it nevertheless indicates elevated investor worry about bank liquidity and a preference for the safety of Treasuries bonds over corporate bonds.
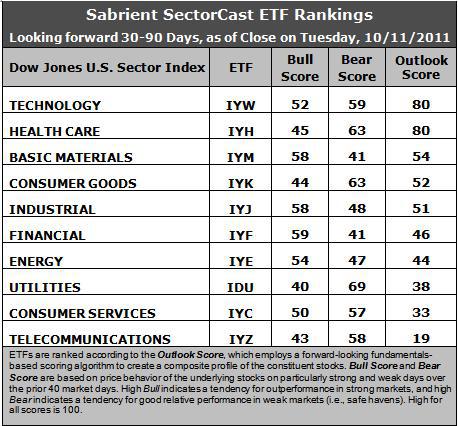
Latest rankings: The table ranks each of the ten U.S. industrial sector iShares (ETFs) by Sabrient’s proprietary Outlook Score, which employs a forward-looking, fundamentals-based, quantitative algorithm to create a bottom-up composite profile of the constituent stocks within the ETF. In addition, the table also shows Sabrient’s proprietary Bull Score and Bear Score for each ETF.
High Bull score indicates that stocks within the ETF have tended recently toward relative outperformance during particularly strong market periods, while a high Bear score indicates that stocks within the ETF have tended to hold up relatively well during particularly weak market periods. Bull and Bear are backward-looking indicators of recent sentiment trend.
As a group, these three scores can be quite helpful for positioning a portfolio for a given set of anticipated market conditions.

Here are some observations about Sabrient’s latest SectorCast ETF scores.
1. Technology (IYW) and Healthcare (IYH) iShares are now in a dead heat according to their aggregate Outlook scores. Actually, they both climbed somewhat from last week and tied at 80. IYW is particularly strong in its return ratios and projected growth rate, while IYH continues to maintain reasonable support among analysts, with little net reduction in earnings projections.
2. There is now a 26-point gap down to third place Basic Materials (IYM) iShares, with an Outlook score of 54. IYM held the top spot in the SectorCast rankings for a long time, but more recently it has been getting the bulk of the analyst downgrades. So, we now continue to see the unusual situation in which IYM ranks last in net revisors (i.e., the most net downgrades) but highest in Projected P/E (i.e., the lowest—best—valuation). So, although the analysts have been reducing earnings projections, the fall in price among stocks within IYM seems to be out of proportion to the magnitude of the earnings revisions. As I suggested last week we might, we are seeing a recovery in the stocks within this ETF.
3. Consumer Services (IYC) and Telecom (IYZ) are still in the bottom two, as they now score a 30 and 17, respectively. Both are weighted down by weak return on sales (poor margins) and high projected P/Es.
4. Overall, the Outlook rankings are back to a more neutral stance, as IYM and IYJ have climbed a bit, and IYW has further strengthened.
5. Looking at the Bull scores, Financial (IYF) has been the leader on strong market days, scoring 59, followed by Materials (IYM) and Industrials (IYJ). Utilities (IDU) is the weakest with a 40.
6. As for the Bear scores, IDU is the clear investor favorite “safe haven” on weak market days with a score of 69, followed by IYK and IYH. IYF and IYM reflect the lowest Bear score of 41, as they have led the market up on strong days and down on weak days.
Overall, IYW displays the best combination of Outlook/Bull/Bear scores. Adding up the three scores gives a total score of 191. IYW also has supplanted IDU with the best combination of Bull/Bear with a total score of 111. This is an improving signal of future market strength.
Top ranked stocks in Technology and Healthcare include Jabil Circuit (JBL), Apple (AAPL), Hi-Tech Pharmacal (HITK), and Humana (HUM).
Low ranked stocks in Consumer Services and Telecom include Shutterfly (SFLY), Green Mountain Coffee Roasters (GMCR), SBA Communications (SBAC), and Sprint Nextel (S).
These scores represent the view that the Technology and Healthcare sectors may be relatively undervalued overall, while Consumer Services and Telecom sectors may be relatively overvalued, based on our 1-3 month forward look.
Disclosure: Author has no positions in stocks or ETFs mentioned.
About SectorCast: Rankings are based on Sabrient’s SectorCast model, which builds a composite profile of each equity ETF based on bottom-up scoring of the constituent stocks. The Outlook Score employs a fundamentals-based multi-factor approach considering forward valuation, earnings growth prospects, Wall Street analysts’ consensus revisions, accounting practices, and various return ratios. It has tested to be highly predictive for identifying the best (most undervalued) and worst (most overvalued) sectors, with a one-month forward look.
Bull Score and Bear Score are based on the price behavior of the underlying stocks on particularly strong and weak days during the prior 40 market days. They reflect investor sentiment toward the stocks (on a relative basis) as either aggressive plays or safe havens. So, a high Bull score indicates that stocks within the ETF have tended recently toward relative outperformance during particularly strong market periods, while a high Bear score indicates that stocks within the ETF have tended to hold up relatively well during particularly weak market periods.
Thus, ETFs with high Bull scores generally perform better when the market is hot, ETFs with high Bear scores generally perform better when the market is weak, and ETFs with high Outlook scores generally perform well over time in various market conditions.
Of course, each ETF has a unique set of constituent stocks, so the sectors represented will score differently depending upon which set of ETFs is used. For Sector Detector, I use ten iShares ETFs representing the major U.S. business sectors.
About Trading Strategies: There are various ways to trade these rankings. First, you might run a sector rotation strategy in which you buy long the top 2-4 ETFs from SectorCast-ETF, rebalancing either on a fixed schedule (e.g., monthly or quarterly) or when the rankings change significantly. Another alternative is to enhance a position in the SPDR Trust exchange-traded fund (SPY) depending upon your market bias. If you are bullish on the broad market, you can go long the SPY and enhance it with additional long positions in the top-ranked sector ETFs. Conversely, if you are bearish and short (or buy puts on) the SPY, you could also consider shorting the two lowest-ranked sector ETFs to enhance your short bias.
However, if you prefer not to bet on market direction, you could try a market-neutral, long/short trade—that is, go long (or buy call options on) the top-ranked ETFs and short (or buy put options on) the lowest-ranked ETFs. And here’s a more aggressive strategy to consider: You might trade some of the highest and lowest ranked stocks from within those top and bottom-ranked ETFs, such as the ones I identify above.

