Good evening all,
My apologies for the inactivity here. The last two weeks have been very busy ones for me. But trading was business as usual!
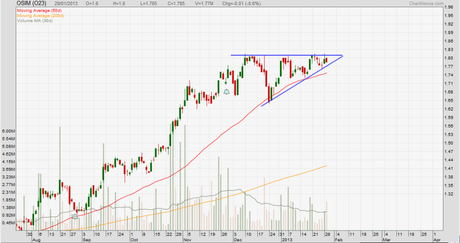
Anyways, today I have a chart of Osim. Osim finally took a breather from a long climb months back. The low $1.80s is immediate resistance, and the 50-day MA happens to be providing good support. If you look at the chart below, you will see a clear-cut, small ascending triangle. Volume behavior makes this triangle even better looking – volume drops generally as the triangle is forming. All that is left to confirm this as a pattern is a breakout. I really like Osim’s picture (trading for upside). A pattern to define a consolidation after a strong trend simply means another trend is going to emerge. Let us see how this goes.

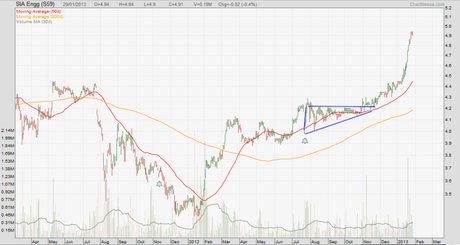
As a “teaser” to what may happen, I have a chart of SIA Engg below. Look at the strong uptrend that emerged from the triangle.

I am just joking about the connection between the two chart. Rightly, we should not expect the exact same result. That will not happen. And, my belief is that any pattern can break out to either side. It is better to wait for a breakout before entering. I am leaning on the bullish side in Osim’s case. But my approach to this set-up is such that I wait till I get confirmation before getting in.
All analyses, recommendations, discussions and other information herein are published for general information. Readers should not rely solely on the information published on this blog and should seek independent financial advice prior to making any investment decision. The publisher accepts no liability for any loss whatsoever arising from any use of the information published herein.
