However, it should be taken in the context of a still supportive economic backdrop, with buoyant excess liquidity and low near-term recession risk.
 The Hindenburg Omen compares the percentage of stocks in a stock index making new 52-week lows versus 52-week highs.
When both are rising above a certain threshold, and we are near a one-year high in the index, the signal activates.
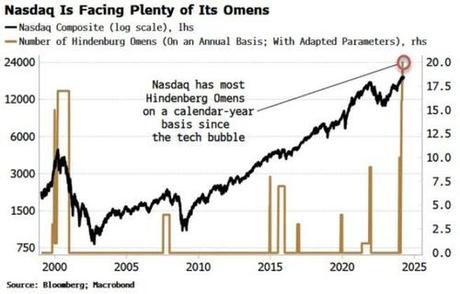
For the Nasdaq, more omens have triggered so far this year than in any calendar year since the 2000 tech-driven top.
As the chart shows, previous rises in the number of omens have coincided with the Nasdaq selling off or moving sideways.
But before traders hit the sell button, there are some caveats to take into account.
-
First of all, it's obviously unwise to base an investment strategy around one signal, especially one with such a small sample size. Indeed, there has been one instance where the annual number of omens exceeds today's value, in the mid 1990s, but this happened in the midst of that decade's potent bull rally.
-
Secondly, there are currently no omens for the NYSE. Stock markets within a country tend to move similarly, and the Nasdaq does not stand out as being more overbought than e.g. the NYSE index (the NYA).
-
Thirdly, the US economy is doing OK and near-term recession risk is low. Furthermore, excess liquidity continues to be supportive for risk assets.
Still, it would be remiss to ignore the notable short-term risks in equities, which the Hindenburg Omens are potentially drawing attention to.
Hedged portfolios, taking advantage of still relatively cheap hedges (e.g. a 10% OTM put on the Nasdaq 100 expiring in December is ~2.6%), are better placed to weather short-term attendant risks.

