Hello all,
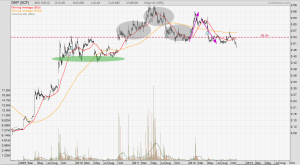
This is OKP Holdings, 5CF.SI. Coming out of the 2008-2009 crisis, OKP put in a good 500% gain, and topped out in the middle of 2011. In the chart below, I draw 3 grey circles to show a head and shoulders pattern. Volume does not satisfy textbook theory but I like the clear 3 regions of price that make up the head and shoulders pattern. In hindsight, the neckline of the pattern was ( and still is) important. OKP hung on to 54 cents, which was the previous all-time high. Strong support prevailed as OKP rallied back up to the head region at 66 cents. This is one of the possible outcomes of a head and shoulders pattern. Price can either break down or shoot up and perform a head test (of course, there are more scenarios like failed ones – whipsaw action along the neckline, flat trading with lacklustre volume for a long period of time, etc). In this case, OKP shot up to 66 cents. Not long after, OKP fell quickly to the neckline level – 54 cents region. Today’s close of 49.5 cents deems OKP as moving clearly below strong support, and initiating a sell call from the head and shoulders pattern (failed head test).
Nearest support can be found at the 43 cents region, which is where the support from a previous trading range can be found. Using the height of the head and shoulders pattern, the target should be just below 43 cents. So with the head and shoulders pattern on the chart, I shall look for more downside.

All analyses, recommendations, discussions and other information herein are published for general information. Readers should not rely solely on the information published on this blog and should seek independent financial advice prior to making any investment decision. The publisher accepts no liability for any loss whatsoever arising from any use of the information published herein.
