Good day all,
This is OCBC, O39.SI. Coming out of the crash five to six years ago, OCBC has been on a general uptrend. Towards the middle of last year, OCBC even beat the previous major high and rallied to the $11.00 region – setting an all-time high record too. However, OCBC turned down, and is a good 13% below that high.
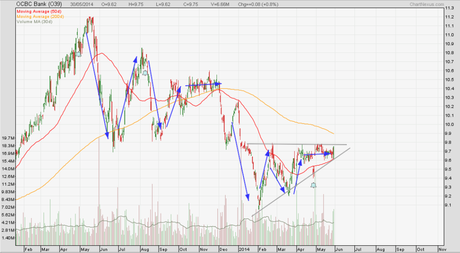
Dropping from the all-time high, OCBC traded in a wide range before a nasty descent at the end of last year. The strong slide continued this year before OCBC started swinging again. I draw arrows in the chart below to show that the there are two similar formations on the chart. Will the same result – further slide – happen again?
I am leaning on the bearish side mainly because of the clear downtrend that OCBC is in (though, OCBC’s very long-term trend is up); also, note that OCBC is comfortably below the 200-day MA. A reader of this site highlighted to be a possible ascending triangle in the making (grey lines). This triangle and the formation I mentioned make this an interesting case to follow in the weeks and months ahead.

All analyses, recommendations, discussions and other information herein are published for general information. Readers should not rely solely on the information published on this blog and should seek independent financial advice prior to making any investment decision. The publisher accepts no liability for any loss whatsoever arising from any use of the information published herein.
