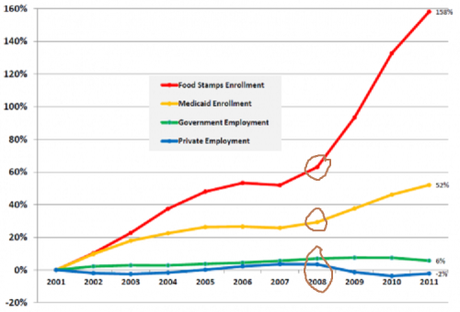
The chart below is from Pennsylvania’s Department of Public Welfare via ZeroHedge:

But on November 6, 2012, over 62 million Americans (62,615,406) voted to give Obama four more years.
Go figure.
No doubt in 2016, there’ll still say it’s Bush’s fault.

~Eowyn

