Last Monday I said it was time to sell in May and we've had a fantastic week to sell into with new suckers pouring in at the top of the market every day. Maybe we're the suckers for going back to "cashy and cautious" into the last two weeks of the month but it's what happens after Friday (options expiration day) that we're concerned about and there's no sense in waiting for the market to turn down if we're looking to take profits.
As noted by Dave Fry, we're still looking very strong on the weekly charts – especially if you ignore that sharp dip in volume that you probably shouldn't ignore. Clearly the market is overbought, but it can stay overbought for quite some time so we may be missing the next 2.5% gain by "chickening out" with "just" a 20% gain since November but, if the bulls are right and this is just the beginning of a Mega-Rally – we have a few more years of upside to partake in.
Seth Masters, of Bernstein Global, says we're right on track for Dow 20,000 and I guess we are, as it was 12,900 last July and now over 15,000 for a 16% gain in less than a year and that means we could hit 20,000 by the end of the decade. In other news, my daughter is now 5 foot tall at 11 years old and that means I'll be shopping for a 10 foot tall wedding dress and probably size 14 shoes. Thank goodness for charts or we'd never be able to plan properly…

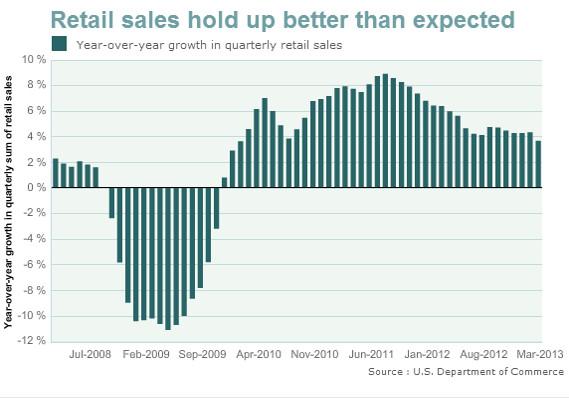
Essentially, in 2009, Retail Sales were 10% lower than they were in 2008, when 160M people were working. Let's call 2008 100 and 2009 90.…
This article will become free after 48 hours (see below for free content). To read the rest of this article now, along with Phil's live intra-day comments, live trading ideas, Phil's market calls, additional member comments, and other members-only features - Subscribe to Phil's Stock World by clicking here.

