Happy days are clearly here again: Housing is up, sideline money is pouring into the markets, FedEx may have warned but what do they know and INTC warned but that's "uncertain". What is certain is the Dow is at 5-year highs and the Nasdaq is at 12-year highs (less than 60% to go and we take back 5,000!) so we are ready to party like it's 1999 again, right?
Not only are the "odds" that the Fed will ease on Thursday up to 99% but the swaps are forecasting 0.25% interest all the way into 2015 now. “The problems have been bigger than anticipated and it will take a while to work our way through these issues,” Larry Dyer, a U.S. interest-rate strategist in New York with HSBC Holdings. “The bond market is pricing in pretty close to a very prolonged period of low growth.”
Central bank action may be losing some of its punch. Currency trades designed to benefit from expectations of stronger growth as the Fed eases are instead losing money. U.S. GDP will expand 2.2 percent this year and 2.1 percent in 2013 according to median forecasts compiled by Bloomberg. Morgan Stanley cut its 2012 global growth forecast to 3.2 percent from 3.7 percent according to an Aug. 15 report, and the ECB on Sept. 6 said euro area output will contract 0.4 percent this year, worse than the 0.1 percent it had predicted three months earlier.
“Nervousness and continued agony over in Europe, the fiscal cliff, election uncertainty means there are a lot of headwinds,” said Mark MacQueen, of Sage Advisory Services Ltd. “Everything is lining up to be more difficult. The Fed will give us language that reassures the market they intend on doing more.” Isn't that great, things are so bad, the Fed just has to promise us more free money!
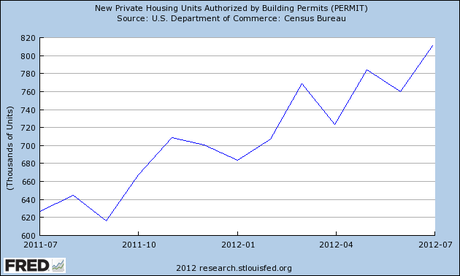
 In Member chat this weekend, we were discussing some other very bullish stories – it's almost as if the Bulls have their own PR team working this rally. One that really pissed me off was featured in DynamicHedge – one of the fine-quality feeds you get from the aptly-named StockTwits. They show this graph as one of their 4 market fundamentals that are indicating the economy is turning around saying:
Construction is a big part of the US economy and it’s also very capital intensive. How people feel about the future can be expressed in how many of them are willing to go out there and take a risk with capital. Home prices and construction affects the consumer sectors of the economy in a major way.
Well that's true, about 50% of our unemployment problem is laid-off construction workers (6M) plus all the affected real estate brokers and mortgage brokers and bank people who worked in home loans etc. etc. so this trend is, of course encouraging but, like the "facts" we get from the GOP, they it is also terribly misleading.
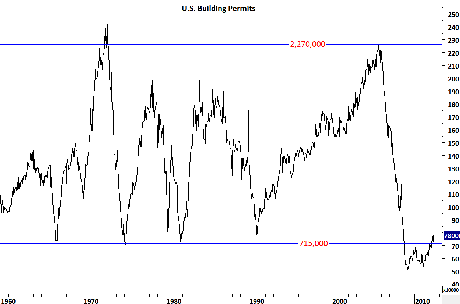
 This is the longer-term chart of US building permits. Kind of puts the other chart into better perspective, doesn't it? This is how the Media is lying to you and misleading you. It's very easy to "show" good year over year and quarter over quarter numbers when you are coming off a period of massive economic destruction, like we are. Keep in mind the Fed has already poured over $2.5Tn into the system over this period of time, much of which was supposed to stimulate the housing market and the Government also spent hundreds of Billions of Dollars on HAMP and other mortgage modification programs aimed specifically at boosting the very critical housing market – AND THIS IS ALL THEY HAVE ACCOMPLISHED SO FAR.
XHB, the Homebuilders ETF, is back to $24.38, where it was in July of 2007, when 250% more building permits were filed and before people realized how low we could possibly go. No one thinks you will fall from 2,250,000 to 550,000 (75%) – when you look at the stocks and ETFs you own now, you probably imagine they can dip 20%, maybe 40% in a "crisis" but not 75% or you probably wouldn't be sitting on them, right? Yet look how many times, in the last 40 years, that construction has fallen off by about that much. Like many things, it's a cyclical business and that doesn't mean we should never invest in cyclicals – it does however, mean we should do so with caution.
But caution has been thrown to the winds, as evidenced by both the very high valuations that are currently being placed on cyclicals (which include Financials) as well as the extremely low VIX which, at 14.38 is back to where it was BEFORE 2007, BEFORE we became aware that the markets were indeed FAR more volatile than we had previously assumed:

Think of the VIX as a measure of your need for health insurance. You had an accident in 2001 that wasn't your fault so, by 2004 you were healthy again and not so much feeling the need for insurance and you VIX was under 15. Then, in 2007, you began having heath problems and had a near-fatal heart attack in 2008 and several hospitalizations since and you felt your need for good health coverage was acute during that time. Now you feel better because they keep you pumped full of QE and you cut back 86% of your health care coverage. Is that wise? Does it make any sense at all? This is what Allan Greenspan once called "irrational exuberance" but he said that in 1996, when the S&P was at 1,200, on the way to 1,560 – before collapsing 58% to 666 over the next 17 months.
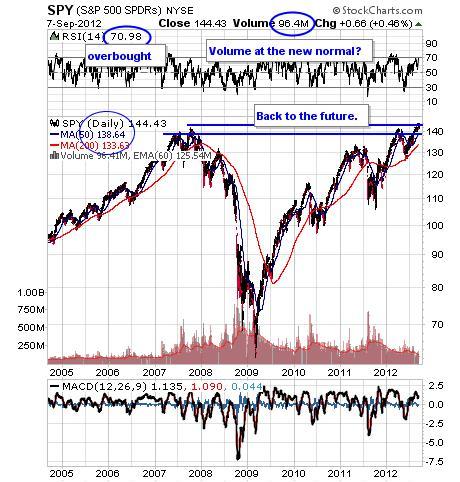
 Now we are back at S&P 1,434 and by no stretch of the imagination are things better now than they were in 2007 yet there is NO FEAR that we will have a correction – does that seem right to you? As you can see from David Fry's SPY chart, the ETF that tracks the S&P has already broken over it's all-time high and up well over 100% from it's 2009 lows making Barack Obama, according to Larry Kudlow, the greatest President of all time:
“I have long believed that stock markets are the best barometer of the health, wealth and security of a nation. And today’s stock market message is an unmistakable vote of confidence for the president.”
-Larry Kudlow, July 20, 2007
Does that sound right to you? What do these all-time market highs prove except that investors have very, very short memories? A lot of people are asking, are you better off now than you were 4 years ago and, as you can see from this chart – there's a hell of a lot of investors and 401K-holders who would have to answer that question but, in order to buy more stocks at these all-time highs, the real question is – are you better off now than you were 5 years ago or 6 years ago – when the future was so bright, we had to wear shades?
Things are certainly better, but they are not great. Don't get fooled into paying "great" pricing for things that are only "better."

