Evening traders/investors,
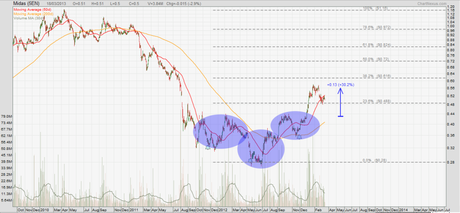
While scanning through local counters, I came across an interesting chart – Midas (5EN.SI) broken out of an inverted head and shoulders pattern.
After stagnating in 2010, Midas went on a year-long downtrend in 2011. Certain news on the fundamental front drove Midas into the dirt – a once $1.00 stock down to the 25 cents region. The last year and a half, Midas traded in a loose range, and formed an inverted head and shoulders. The 200-day MA also made a rounded bottom as Midas picked up steam to break out of the right shoulder early this year. A simple projection based on the pattern gives me a target of about $0.58. Midas already hit that level months back. Usually, after a target from a pattern is touched, price starts retracing. As of yesterday’s close, Midas is at $0.50.
Although the pattern is considered complete and successful, I believe Midas still has more room for upside. The technical catalist for the recent uptrend is the breakout from the inverted head and shoulders. This pattern is quite large, and it formed right after a long downtrend. It looks to me Midas has recovered from the doldrums, and there seems to be more room for upside. The trend is strong – this is clearly supported by the moving averages. The only problem I have with bullish views on equities is that I am generally bearish on the general market. So I will not be getting in anytime soon, but I really favour a long-term trend trade on Midas.

All analyses, recommendations, discussions and other information herein are published for general information. Readers should not rely solely on the information published on this blog and should seek independent financial advice prior to making any investment decision. The publisher accepts no liability for any loss whatsoever arising from any use of the information published herein.
