In the digital world, it seems like everything is about SEO. We want Google to find our content, so we jump through all sorts of hoops to make sure our content ranks high on relevant searches.
It's not easy, and having a thought-out SEO strategy is more important than ever for organisations of any size.
Content creation certainly plays a big part in SEO strategies. But did you know that infographics have been and still are one of the best forms of content to create for SEO purposes?
You may be wondering how that makes sense. Infographics are essentially images, so why would Google choose an image on something like "5 Steps to Retire Early" over a lengthy, detailed blog post or video on the same thing?
Well, Google is all about rewarding happy user experiences. It does that by measuring hundreds of different factors, which infographics can directly impact.
And the SEO value of infographics matters more now than in the past because infographic design today has become incredibly accessible. Designers and non-designers alike can all create engaging infographics.
How do infographics influence SEO?
In Brian Dean's list of Google's ranking factors, he lists a number of factors that infographics can easily influence. Here's just a handful of them:
- Mobile optimised
- Number of backlinks
- Page loading speed
- Keyword in title
- Keyword in the title tag
- Title tag starts with the keyword
- Keyword in description tag
- Keyword appears in H1 tag
- Keyword density
- Image optimisation
- Bounce rate/Dwell time
- Repeat traffic
- Keyword in URL
You can get backlinks pointing to your content organically if people stumble across it and just love it. But that's not a strategy. Most content creators have to hustle hard and grind to get backlinks for their content.
But infographics have such mass appeal, are super engaging and highly visual! They're the most shared form of content online for a reason, and content creators/marketers understand their value. So your chances of getting those backlinks are pretty darn high.
Then there are the typical ways your infographic can be SEO optimised. In particular, infographic posts should focus on a long-tail keyword which is included in places like the H1 tag, body text, URL and so on (like a typical blog post).
There are also subtle ways an infographic helps with SEO. A captivating infographic post affects dwell time (how long people spend viewing your post) and repeat traffic (how often they come back). The more time people spend viewing your content and coming back to it, the more engaging it appears to Google and ranks higher.
Social media shares have no direct impact on how content is ranked by search engines. However, with more and more shares, the likelihood of your content being viewed and linked back to are much higher. So if you create share-worthy content, and have a solid social media marketing strategy in place, expect it to boost your infographic's SEO performance significantly.
Now, you can't just create an infographic about anything, post it to your blog and expect it to blow up. Like any content you choose to create, you want a structured process to make it all count.
And that's what this post is really about. Anyone can say infographics are great for SEO, but I want to show you how to get them to work for you.
I've broken down the process for creating an SEO-optimised infographic into two easy parts, research and seo-optimisation.
Part 1: Research is key to a brilliant, SEO-tastic infographic
What makes an infographic intriguing and engaging is the research behind it. With access to the right infographic templates, it's pretty easy to design something that looks great. But insightful and compelling content is what keeps your audience locked in, gets them to share it, link back to it and more.
We can break the research phase down into three simple stages.
- Choose a specific topic relevant to your audience
- Choose your long-tail keyword
- Conduct research on your topic
You have to choose an infographic topic relevant to your target audience. So let's say you're into education and learning tools, which is a pretty broad topic. What kind of questions do people in this industry ask? What are popular topics today? How can you find this out?
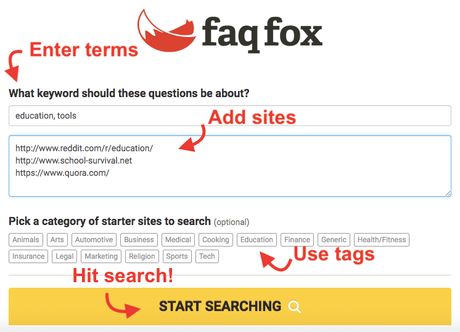
One way is to use tools like FaqFox to scrape forums for questions directly related to your topic.
First, enter your topic. Then enter relevant sites/online forums where people would ask questions about it. You can even click on one of the tags below for a few site suggestions. Then hit search:

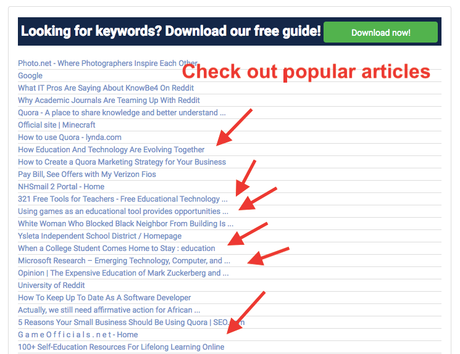
FAQFox pulls up popular posts on your topic that you can check out and start brainstorming over.

Another way to do this is to see what Google's auto-suggestions are as you type in terms related to your topic. It's a great place to start, especially if the topic is a little new to you:

Once you've got a topic in mind, you have to choose your angle of approach. More importantly, you'll need to determine a long-tail keyword for your infographic.
Keyword research matters because it's the only way quality content sees the light of day.
If you use terms that people don't typically search, Google won't understand how your content is relevant to what people want. So it won't pull up your content in its search results.
The whole point of research is to discover something new, validate an older idea, or debunk current ones. To do that, there are tons of research methods for you to use to get your answers:
- Asking professionals in your industry
- Consulting academic resources
- Analyzing existing data
- Surveying or polling your users
- Running your own experiments
I'll explain why some of those less obvious research methods work so well.
Asking your industry
A great way to add value to your infographic is to get insights from industry professionals. 'People' is a vague term, but when you can say "300 teachers explain their favorite tools for teaching kindergartners" or "100 instructors found X most useful to their online courses", your infographic is going to turn heads. It also gains instant validation as an authoritative infographic.
Surveying or polling your users
There are a number of tools out there, like Survey Anyplace, Survey Monkey or Pollfish that make conducting surveys simple. One tool's going to be more user-friendly than another, more versatile, and convenient in how it provides results. So take your time to learn a little bit about each one to see what works best for you.
Running your own experiments
Running your own experiment is a great way to validate yourself as a leader in the industry.
You get to establish yourself as a direct source of new, helpful information. And your unique findings are exclusive to you, which also makes promoting your infographic a lot easier.
Part 2: Format your infographic post so that it's search-engine optimised
- Mobile optimised
- Number of backlinks
- Page loading speed
- Keyword in title
- Keyword in the title tag
- Title tag starts with the keyword
- Keyword in description tag
- Keyword appears in H1 tag
- Keyword density
- Image optimisation
- Bounce rate/Dwell time
- Repeat traffic
- Keyword in URL
In a lot of ways, when it comes to SEO, you can treat your infographic like any other blog post. There are plenty of things like using headers, inserting keywords, your URL structure, and more, which will influence your infographic's SEO power. Let's take a look at that list I shared before:
If your blog is already mobile-friendly, then you're all set. If you're not sure, run this test to find out and make the necessary changes. Some of the factors in that list you can directly influence, while others depend on the quality of your content, the topic, how readable it is and so on.
Here are a few essential tips for posting an SEO-optimised infographic.
Insert your long-tail keyword in the right places
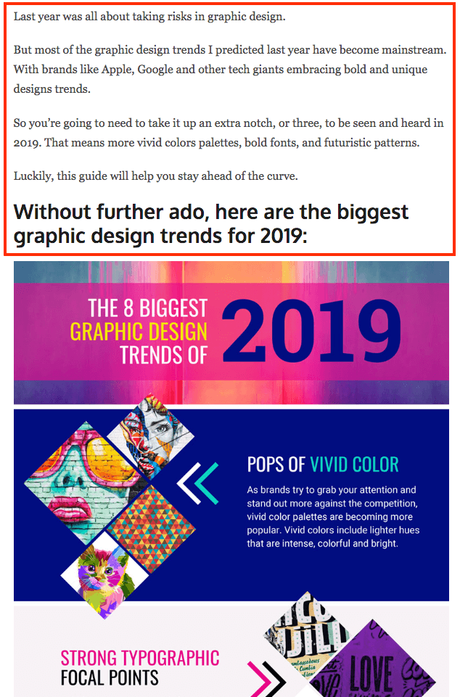
Like any blog post, you want your long-tail keyword to show up where it counts - the introduction, the URL, in the H1 header and so on. Be sure to write up a brief introduction (100-150 words) explaining what the infographic is all about, too. This lets you include your long-tail keyword, other relevant terms, and link out to helpful resources. An intro is also helpful to your audience, as well. Here's an example:

Use SEO plugins to help optimise your post
I'm a big WordPress user, but it really depends on how your blog is set up. For WordPress, a simple tool like Yoast lets you tweak important sections (the meta description and URL slug) and it also lets you know what could be improved/added. There are a number of alternative SEO plugins that work just as well, it just depends on what's best for you.
Remember to optimise your infographic, too
Your infographic itself also needs to be optimised. Here are a few SEO factors that matter.
Like any image in a blog post, you want to include your alt text. Alt text tells Google what an image is all about so it knows when to pull it up. Typically, you can just use your long-tail keyword as the alt text.
Page loading speed is also an important factor, and that's impacted by the size and file format of your infographic. Your infographic should be a relatively small image file (less than 1 MB), its resolution should be around 72-100 PPI, and it should be the optimal file format (PNG, JPEG or GIF). You can use tools like compressor.io to reduce the size of images.
Promote your infographic and get those backlinks!
Finally, backlinks are a major contributing factor for helping your content rank. The more relevant sites pointing to your content, the better. Backlinks tell Google your content is highly valuable, completely relevant, and well-liked for that topic.
It's important to have a strategy in place to get backlinks, beyond just sharing it online. Also, if you conducted a survey to create your infographic, then reach out to your respondents and ask for a backlink. They might be interested in the results and happy to oblige you.
Generally, content creators and marketers understand the value of visual content, particularly infographics. They know that featuring your infographic on their blog or sharing it on their social pages will be valuable to their audience as well. So if you reach out to the right people, you can expect positive responses.

