 It's been a wild morning already.
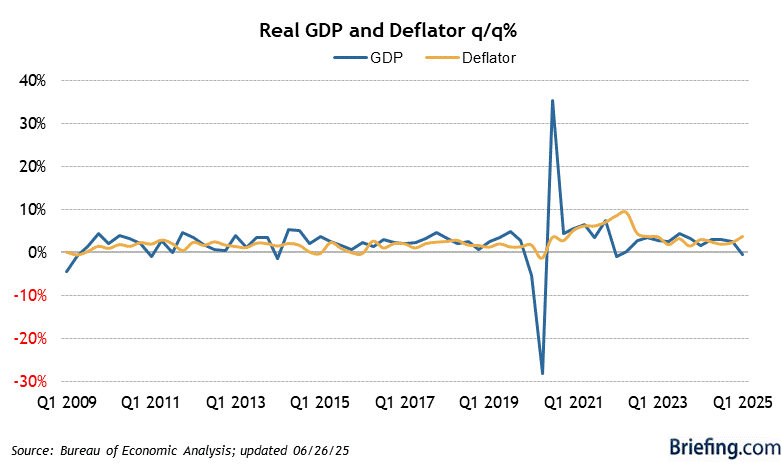
Dow Futures (/YM) have already swung up and down 100 points as we wait for what is only the 2nd estimate of our Q1 GDP. The first estimate was 0.2%, which is near contraction so, of course, the markets have since made record highs since the expectations are for more QE for a slow economy. But why should we have more QE when the first $4Tn hasn't worked at all?
Well, let's not say it hasn't worked – had it not been for QE and other bailouts, we'd be Greece but DESPITE all the effort, our economy still isn't growing and we're in danger of becoming Japan now, who have been running ZIRP for 20 years with no real improvements and now they've added QE on top of that and STILL their GDP, when priced in anything other than Yen, is negative.

Our own revised GDP is out and it's -0.7%, 0.9% lower than the last estimate and now clearly contracting. We'll see if bad news is still good news but, as I said back on May 20th, when we were looking ahead for the month and the S&P was at 2,127, we expected to see 2,070 (-2.5%) by June 9th before we made a move higher. So far, we've already had half the drop, to 2,100 and that was good for a gain of $1,350 per contract on /ES shorts (and we did call for the bounce off 2,100 but back short now at 2,120 again) and our chart, essentially, remains the same (3 of 5 green is bullish, 3 of 5 red is bearish):
Dow 17,600 19,360 20,240 21,120
S&P 1,850 2,035 2,128 2,220
Nasdaq 4,000 4,400 4,600 4,800
NYSE 11,000 12,100 12,650 13,200
Russell 1,200 1,320 1,380 1,440
Even with the BS bounce this week, we're still in the same exact range we were in 10 days ago, making no progress whatsoever and the data we've gathered since then has been:
- Existing Home Sales: -5%
- Philly Fed: -10%
- Leading Indicators: +0.3%
- CPI: Flat (core inflation up 0.1%)
- Durable Goods: -5.6%
- Case Shiller: Flat
- Housing Prices: -0.3%
- Consumer Confidence: +1.1%
- Pending Home Sales: +2.3%
- GDP: -0.9%
 So, what exactly is your long-term investing strategy? Is it that, hopefully, we keep getting worse and worse data, quarter after quarter so the Fed keeps pumping money into the markets to mask over an ever-weaker economy? Wow, that does seem like a brilliant plan – try explaining this to an 8-year old without sounding like you are insane or, as I said back on May, 15th, when the S&P was punching over 2,120: "Are you people on drugs?"
As you can see from the chart on the left, Corporate profits have dropped off considerably. Is that also a part of your long-term investing strategy? The less they earn, the better it is, right? As I have droned on and on about this year, the actual profits of corporations have been dropping (and finally we can see it) but they don't seem to be dropping because the Corporations have been covering it up by buying back their own shares – which then divides those profits by a smaller number of shares and makes them LOOK stable.
 The problem is that you, as an investor, are paying more money per share for a company that is, in fact, earning less actual money and, even worse, they have spent their valuable CASH!!! buying back their own shares at bubble highs – just to give you the illusion that their stock is worth more than it really is. Even worse than that, they are going heavily into DEBT at a record pace to maintain this illusion. Again, is this really your idea of a healthy long-term investment strategy?
And let's not forget that, if we remove AAPL's $18Bn Q4 and $13.5Bn Q1, we'd be testing the lowest levels of Corporate Profits since 2011, which wouldn't be so bad except for the fact that the S&P is now priced 68% higher than the 1,250 we were at in 2011. Somewhere between here and 1,250 is the true value of the S&P – according to our Big Chart and our Fundamental Analysis, we still don't have enough evidence to support more than 1,850, which is a 12.5% drop from here.
 The question is, can the Fed and their Corporate Masters maintain the illusion of a healthy economy long enough for the actual economy to grow big enough to support their prices? Unfortunately, this GDP number is certainly not supporting it so we will remain "Cashy and Cautious" into the weekend and yes, the primary hedge in our Short-Term Portfolio is still SDS ($20.04), the ultra-short on the S&P.
Rather than selling our Long-Term positions in May and going away, we're going to invest in improving our SDS hedge today – taking advantage of the window-dressing and then we'll see if they "fix" Greece and China by Monday but, if not, I think we may get a quick pay-off.
Have a great weekend,
- Phil
Do you know someone who would benefit from this information? We can send your friend a strictly confidential, one-time email telling them about this information. Your privacy and your friend's privacy is your business... no spam! Click here and tell a friend!

Paperblog Hot Topics
COMMUNITY BUSINESS

-
worldwide
1243760 pt -
 Martin Zwilling
766659 pt -
trendmarketers
737838 pt -
itzmealie
600344 pt