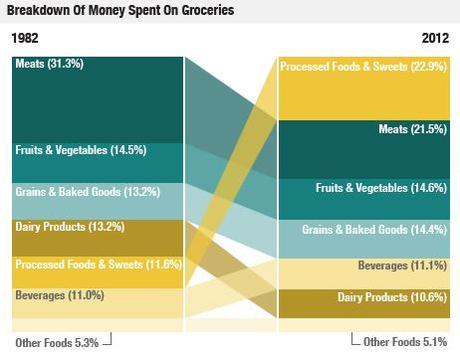
 NPR’s Planet Money team created a set of graphs recently depicting the American economy. The first two parts in the series were What America Buys and What America Does For Work. The latest is more germane to this site, What America Spends on Food. Here are five interesting facts:
- As compared to 30 years ago, we spend less money on food as a percentage of our income. In 1982 the figure was above 12%. In 2012 it is less than 9%.
- We spend roughly twice as much as a percentage of our food bill on processed foods and sweets. 11.6% in 1982 as compared to 22.9% in 2012.
- The percentage of our food bill devoted to meat has dropped from 31.3% to 21.5%.
- Pork chops represented the steepest decline in price per pound as compared to 1982 (37.9%), while peppers exhibited the greatest increase (34%) of foods in the study.
- Prices for all five meat sources included in the study (pork chops, chicken legs, bacon, steak, and ground beef) declined more than 10% from 1982 prices.

Image source: graph
Image source (upper left): Metropolitan Museum of Art

