Evening all,
First, I want to wish all of you a belated blessed christmas. I hope your festive season went well.
Today, I have a chart of the US Dollar index. In general, the greenback should have an inverse relationship with equities. In November and December, while equities made a somewhat surprising climb, the US Dollar fell (EURUSD at levels not seen for at least half a year). This rally happened despite whatever cliff talks/scares made headlines. Sidetrack: I read an article online and saw the word “cliff-mas”! Anyways, I was long and happy since I played certain stock CFDs on the long side. Ever since my last post on forex, I have not been active in that market.
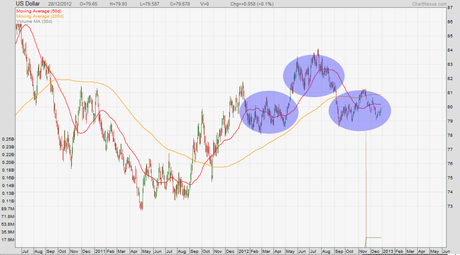
The Dollar index was in a straightforward uptrend from 2011 to the middle of 2012. After that, the greenback got hammered and fell below 80. In the chart below, you will see 3 boxes. I box up 3 regions of price to show the popular chart formation of a head and shoulders. I like to describe such a pattern as consisting of 3 regions of price. Right now, the US Dollar is forming the right shoulder.
Naturally, I will be looking at this pattern as a topping one. The long-term uptrend in equities looks even better now compared with 2 months ago because of a rally out of a healthy correction. And, take note that the Dollar index is clearly below the 200-day MA. I will continue looking for long set-ups in EURUSD and see if this pattern does end up being a top.

All analyses, recommendations, discussions and other information herein are published for general information. Readers should not rely solely on the information published on this blog and should seek independent financial advice prior to making any investment decision. The publisher accepts no liability for any loss whatsoever arising from any use of the information published herein.
