I’ve started a little research project. Most mornings while I stand on the corner I count the number of cars that pass by as I wait for my bus transfer from downtown Minneapolis to downtown St. Paul. Here are my results:
-
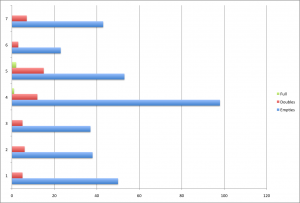
Tuesday I counted 50 cars passing by as I waited for the bus, 5 had 2 people. 0 had 3.
Today I counted 38 cars, 6 had 2 people. 0 had 3.
The following Tuesday: 37 cars with one person, 5 with 2 (as a side note, I saw 2 Priuses both with 1 only person)
Wednesday: 98 cars with solo drivers, 12 with 2 (including a couple city vehicles), 1 with 5 people (all adults), 3 bicyclists, 1 empty (see the note below) hybrid
Some weekday: 53 empty (that’s what I’ve taken to calling the ones with only the driver), 15 with 2 people, 2 with 4 or 5. 1 bicyclist 1 empty Prius (my counting got thrown off this time, more than previously, but the ratio is about right, 3-3.5/1)
Wednesday: 23 empties 3 multiples (30+ min earlier than normal)
Friday morning: 43 empties 7 doubles (30+ min later than usual). Now, I was on the phone and trying to count, so I may have missed a few, but you get the gist.
I’ve included a handy bar graph as a graphic representation. The labels are missing, but the blue are empties, red represents “doubles”, and greenish (appropriately) indicate full cars.
Additionally, here’s a note about my methodology. I don’t count car seats in my survey. It’s often too difficult to tell if there are kids back there. I do not include taxis, though I’ve seen mostly empty ones. I am including delivery trucks/commercial vehicles. Other than that, I’m keeping mental track, so my numbers may not be 100% accurate, but it’s pretty darn close. Also, I didn’t keep track of time. Sometimes my bus arrived early/on time and I had plenty of time to count. Other days, not so much.
(editorial note: Why does everyone get their own damn car?)
[Image]


