Evening all,
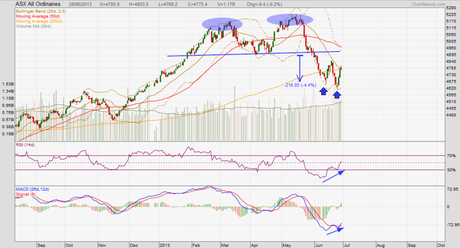
Short post on the Australian bourse for today. The ASX came off highs at the 5200 region along with global markets. The picture on the chart is a classic double top topping pattern with slightly higher highs for the right-hand side peak. A breakout below the neckline signalled confirmation of the pattern, and the downside target was hit with ease. Now, the ASX is flirting with the 200-day MA, and a possible reversal kind of pattern may be in the making. The ASX made two dives down to make recent lows; the second one crept below the first by a small margin (see two blue arrows). Indicators are doing the opposite of price action by making higher lows in the same time period. This is a simple illustration of a bullish convergence. I strongly believe in divergence and convergence signals from indicators. So, let us see how this pans out.

All analyses, recommendations, discussions and other information herein are published for general information. Readers should not rely solely on the information published on this blog and should seek independent financial advice prior to making any investment decision. The publisher accepts no liability for any loss whatsoever arising from any use of the information published herein.
